Code smarter, work faster, perform better!
Gain instant insight into delays, improve delivery, and make software development enjoyable again with Agile Analytics.
Stop Wasting Time & Money on Inefficiencies
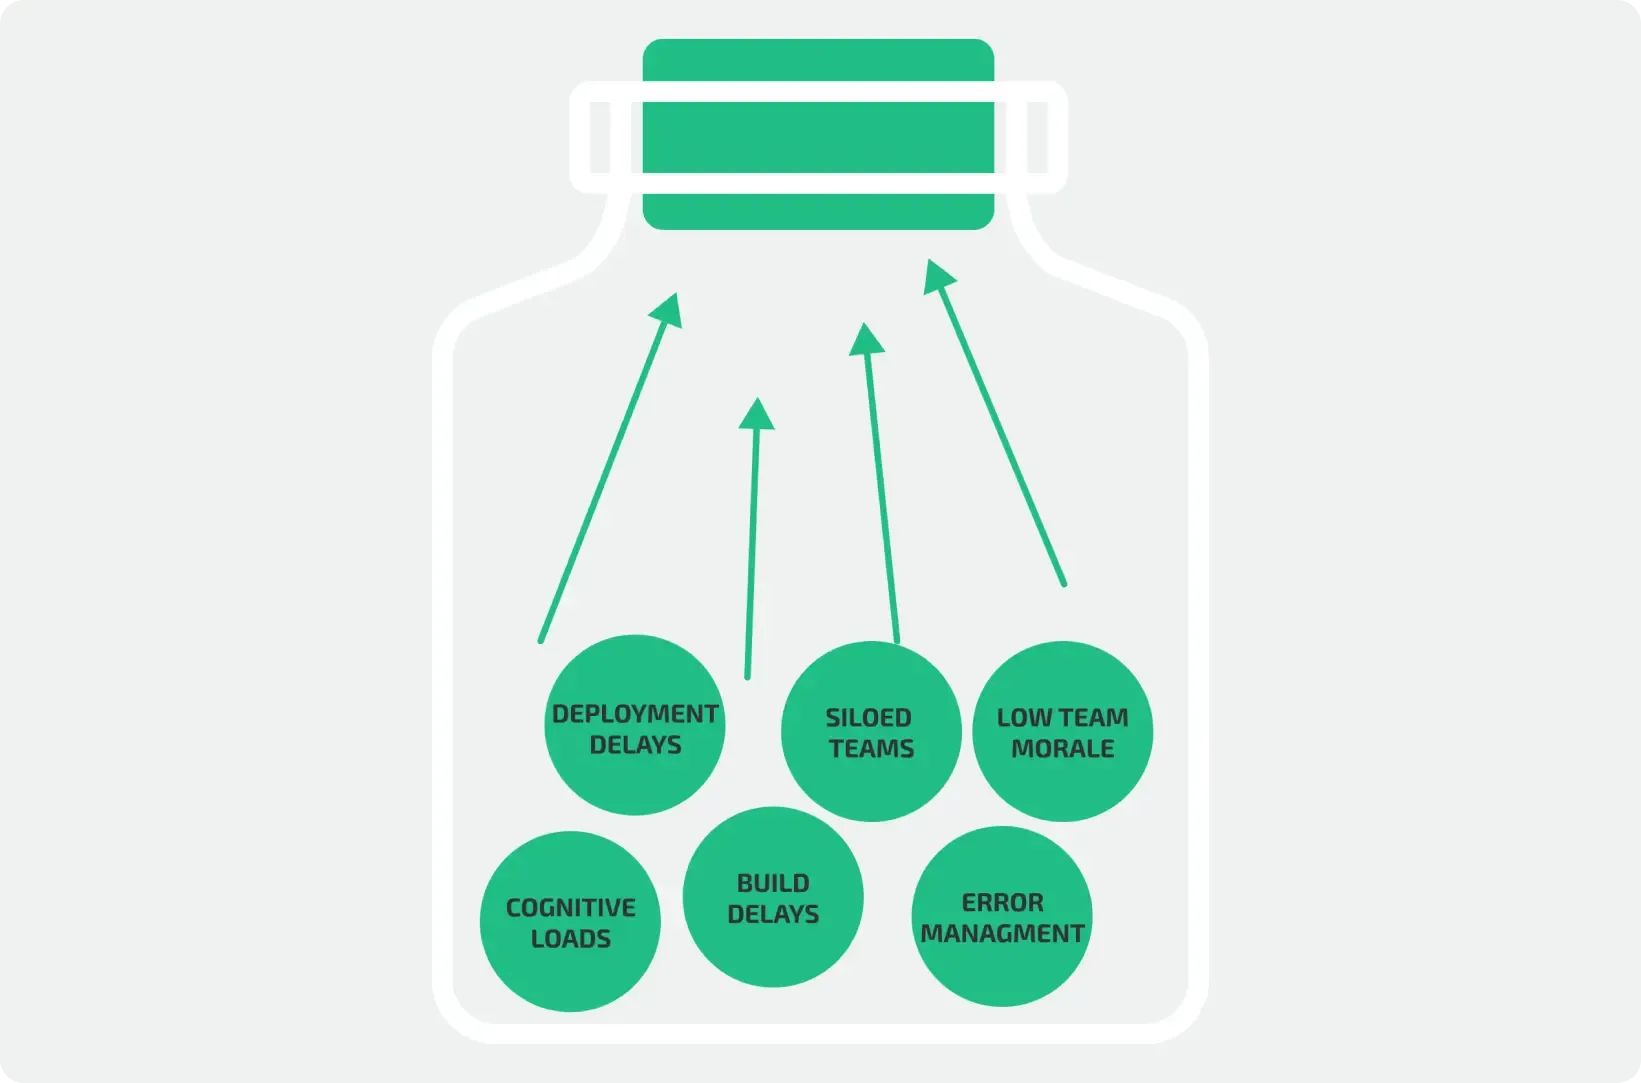
Hidden bottlenecks cost more than you think — and more than you’d like.
The 3 Biggest Bottlenecks & Solutions for Dev Teams:
-
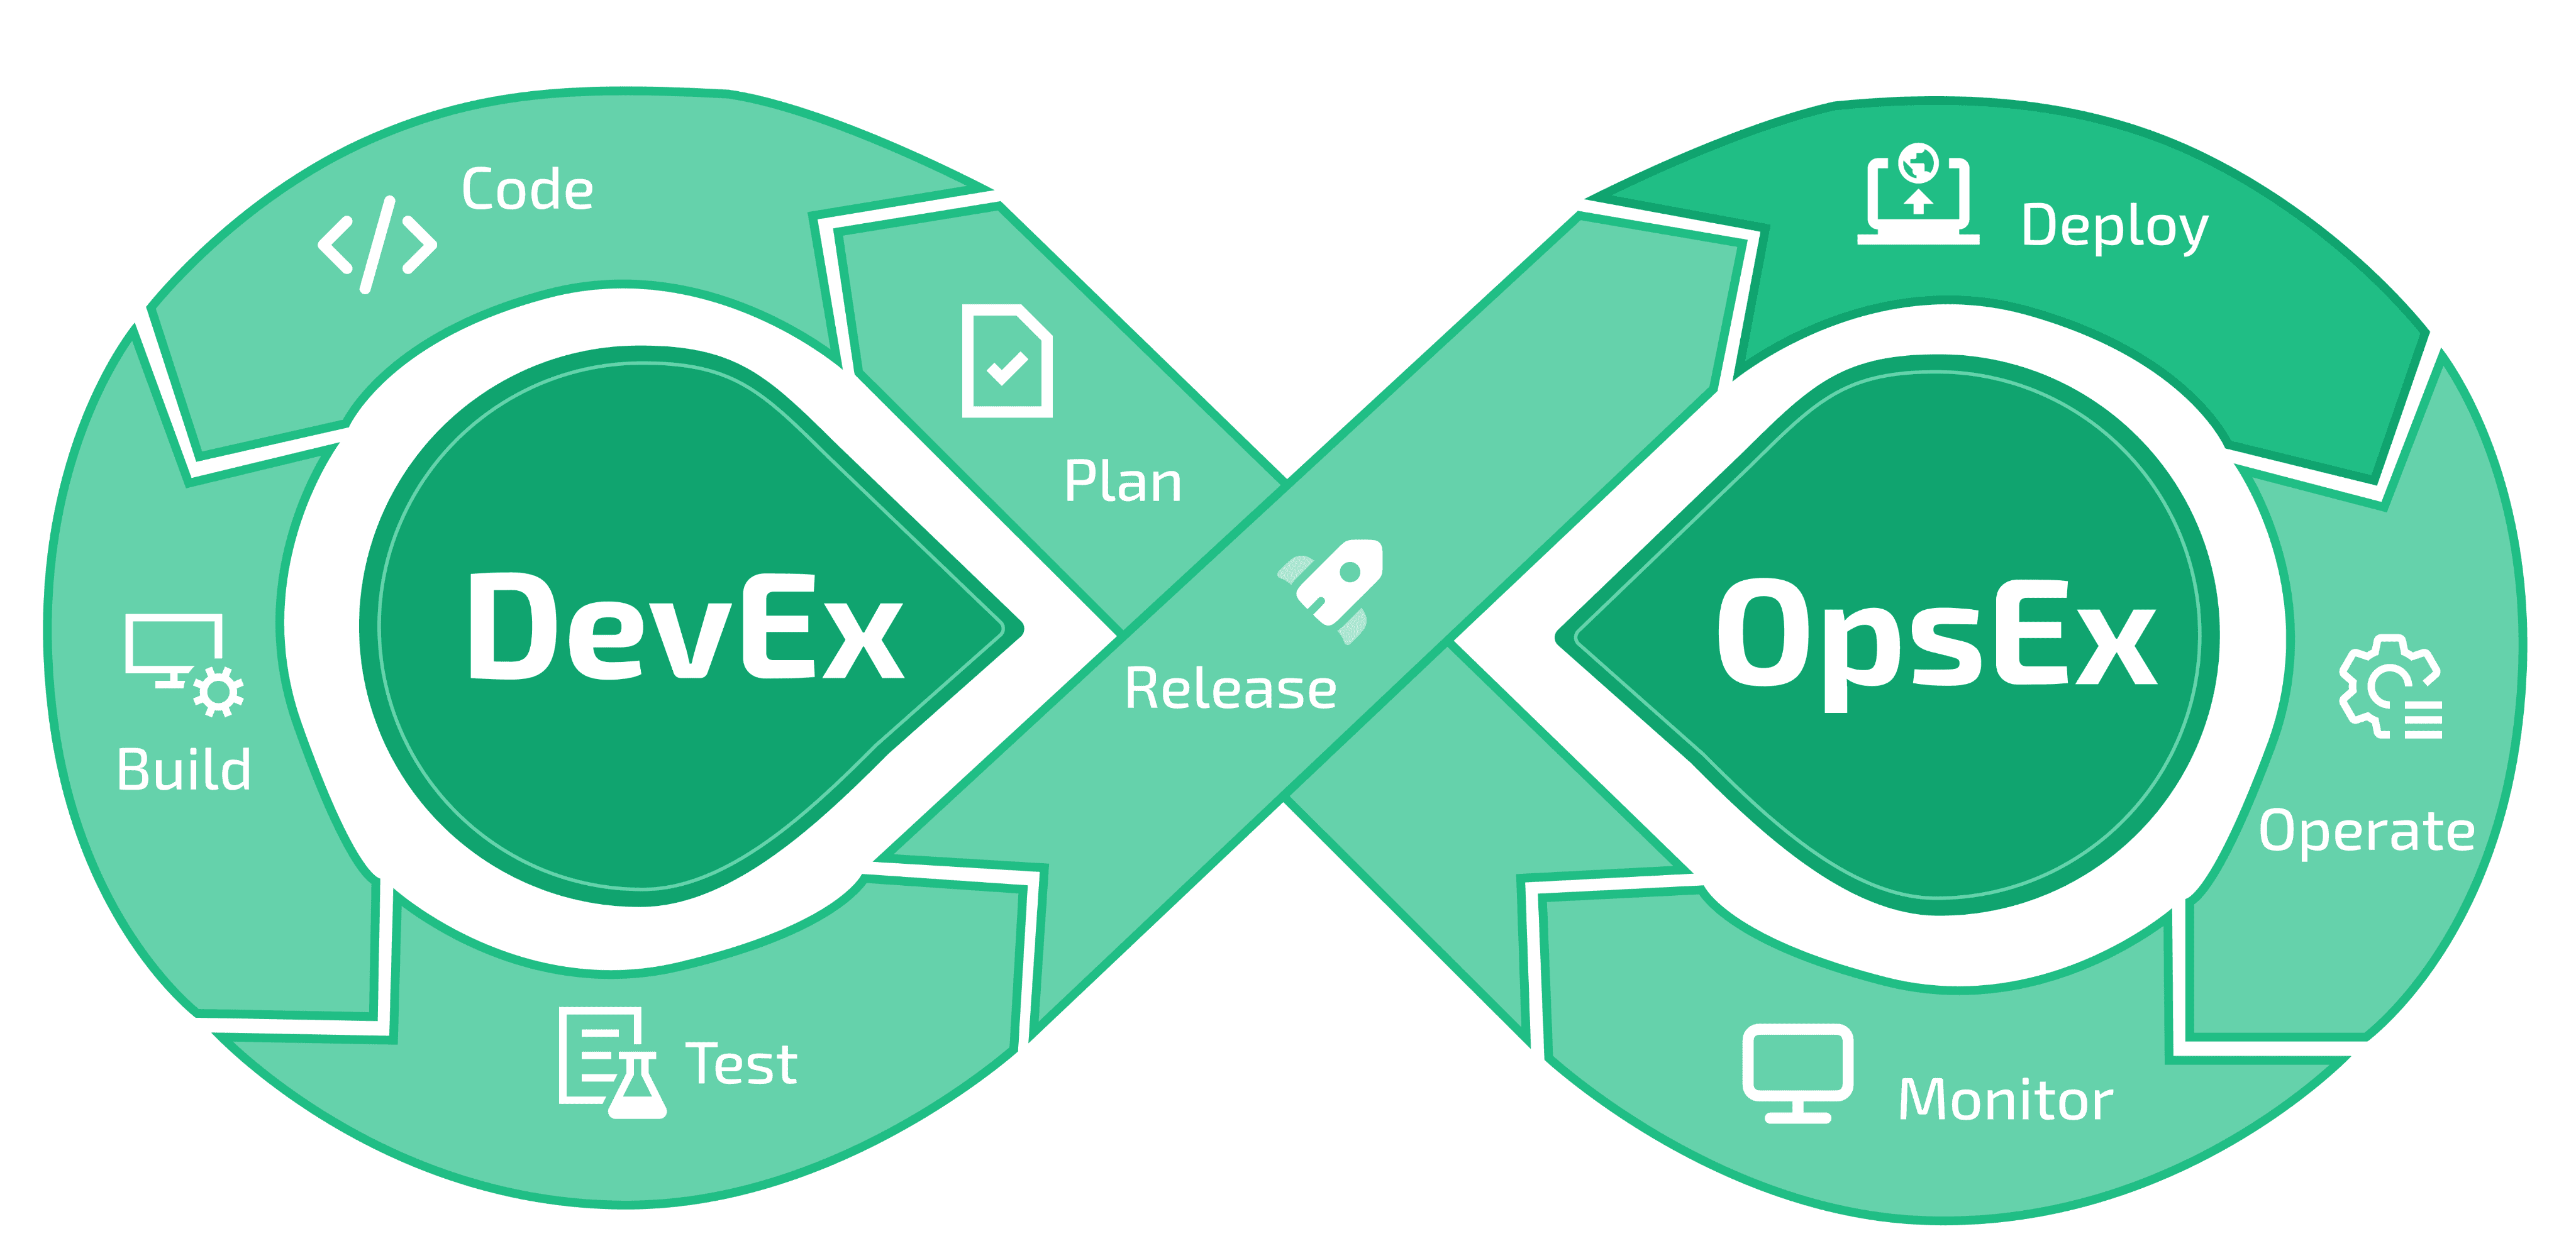
🕒 Slow Feedback Loops – Delays slow down work, from long builds and slow deployments to hard-to-start test environments. Focusing on the Developer Experience ensures that developers can concentrate on what truly matters: shipping code.
-
🔄 Inefficient Handoffs – Poor collaboration and unclear processes waste time and reduce productivity. With Agile Analytics’ Continuous Improvement & Engineering Metrics, guesswork is reduced, and impact is increased!
-
💭 Cognitive Overload – Overworked teams make more mistakes, leading to costly problems. By making critical information searchable and centralized in an Integrated Developer Portal, cognitive load is reduced, engineers are happier, and teams are more productive!
Give your team the tools to work smarter, faster, and with more enjoyment.
👉 Book a free demo and discover how Agile Analytics can optimize your development process!
The Data & AI Revolution in Software Development
⛰️ Software development generates massive amounts of data — from build logs to Jira metrics. Other industries are already leveraging AI to optimize processes, such as factories that continuously refine operations using machine data or AI-driven breakthroughs in agriculture.
But in software development? This kind of AI-powered process optimization is still rare — and that’s a missed opportunity.


Agile Analytics: Acceleration
Gain control over your development process — without guesswork
Feeling that things are slowing down but unsure where? Is it slow builds, bottlenecks between teams, or cognitive overload?
With Agile Analytics, you discover where time is lost — and how to fix it permanently. No more assumptions — just data-driven solutions.
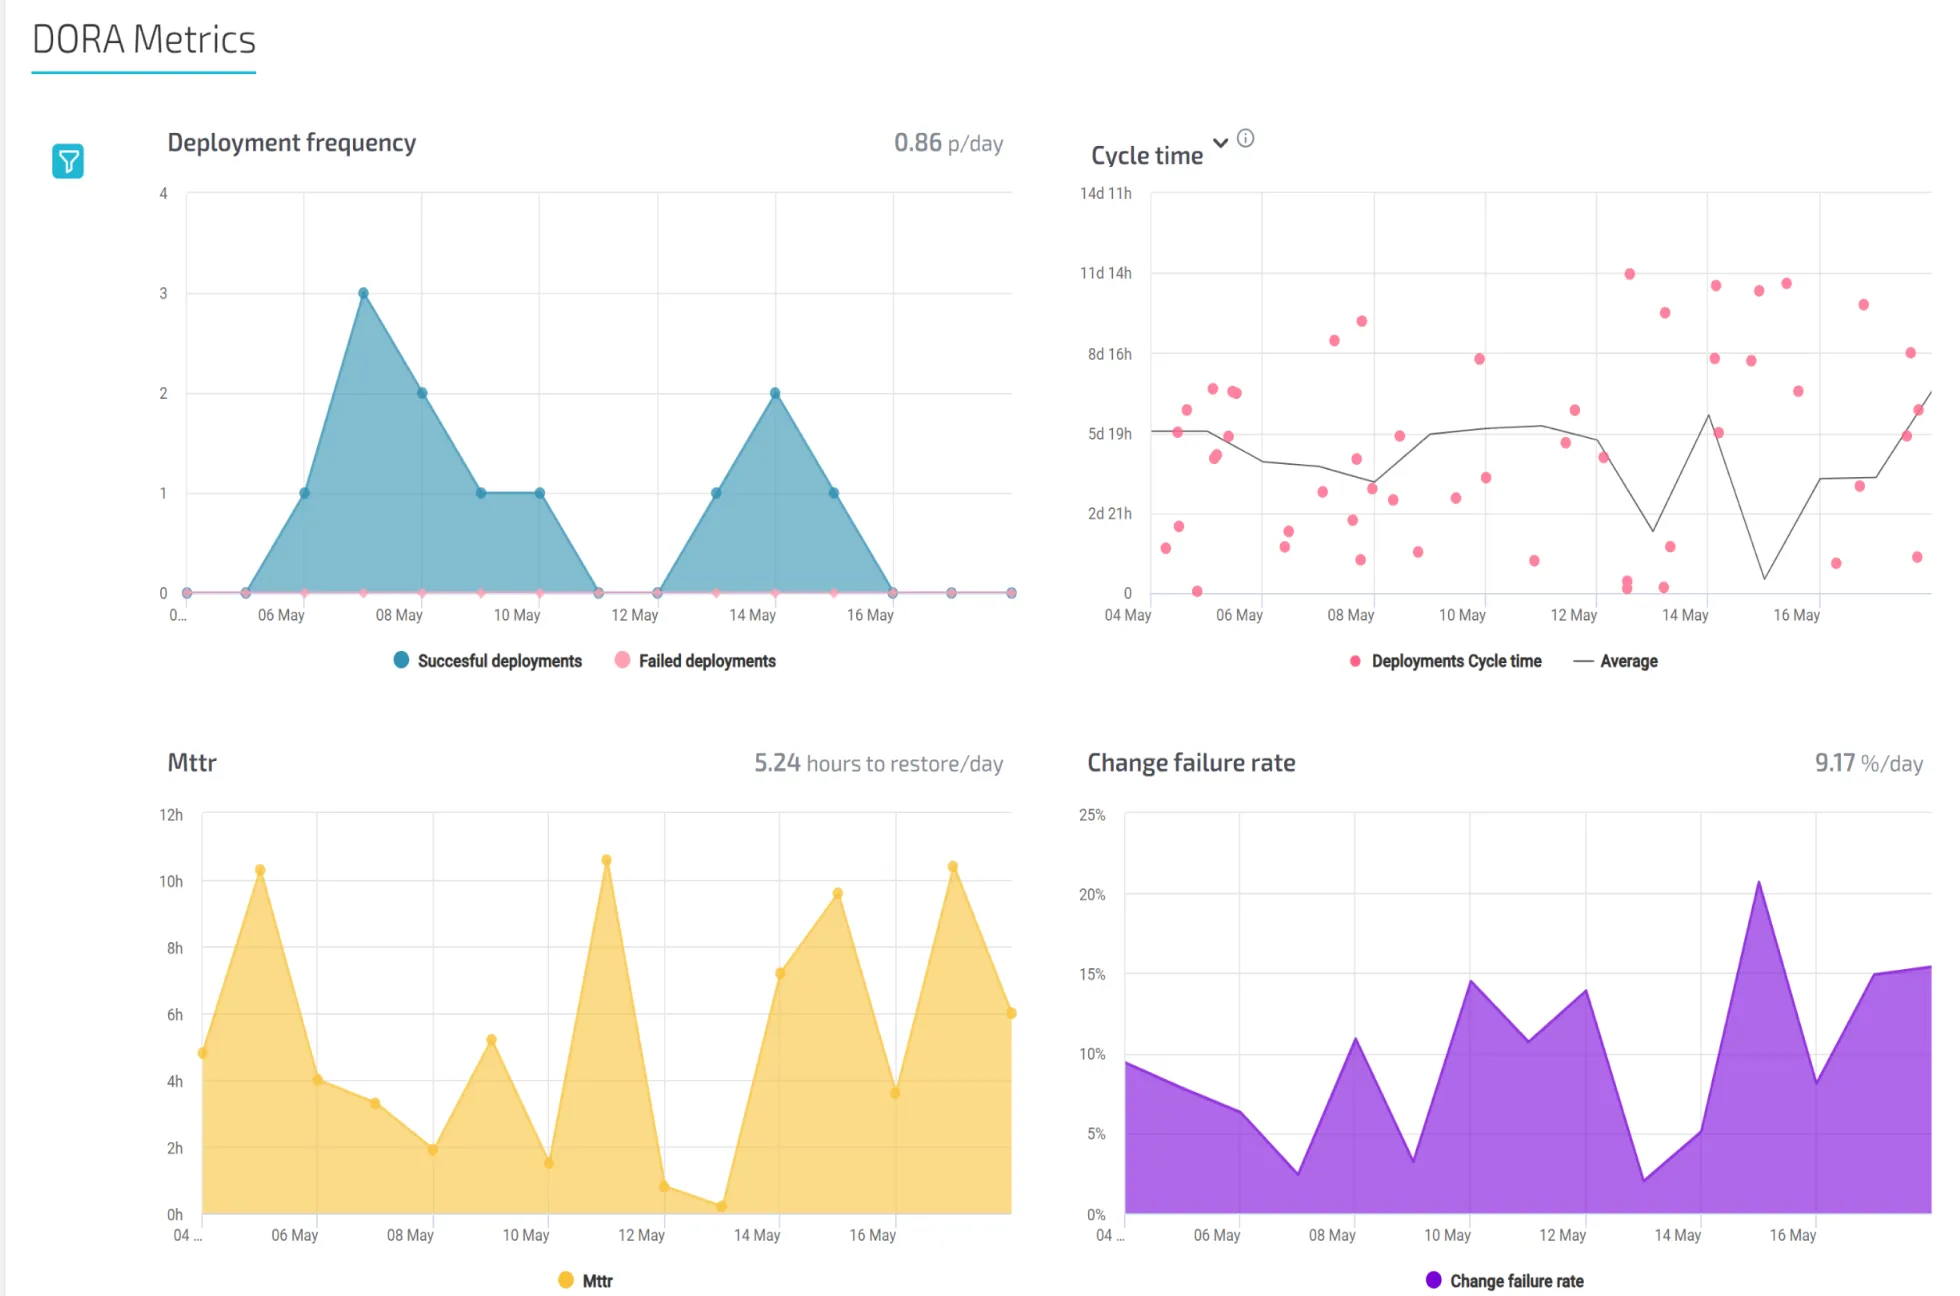
We combine Engineering Metrics (such as DORA & SPACE) with your tools (Git, CI/CD, Jira) and qualitative insights from your team. This way, you know exactly where the bottlenecks are and what needs to be prioritized.

🔧 What You Get:
- Real-time data and AI-driven insights into major bottlenecks
- Hands-on workshops to immediately tackle blockers
- Short-cycle improvements based on proven methodologies
- Metrics that matter, like Lead Time, Deployment Frequency, Change Failure Rate, Developer Satisfaction & Flow Time
🎯 What It Delivers:
- Less wasted time & frustration
- Faster delivery & higher reliability
- More focus & work satisfaction in teams
Every day, a 30-minute delay per developer? That quickly costs your team €50,000 per year.
📦 Agile Analytics: Full Stack
The Swiss Army Knife for Your Development Process
You have tons of data in GitLab, Jira, CI/CD, and monitoring tools. But real insight is missing.
What are the bottlenecks? Where are the biggest gains? And how do you know you're improving the right things?
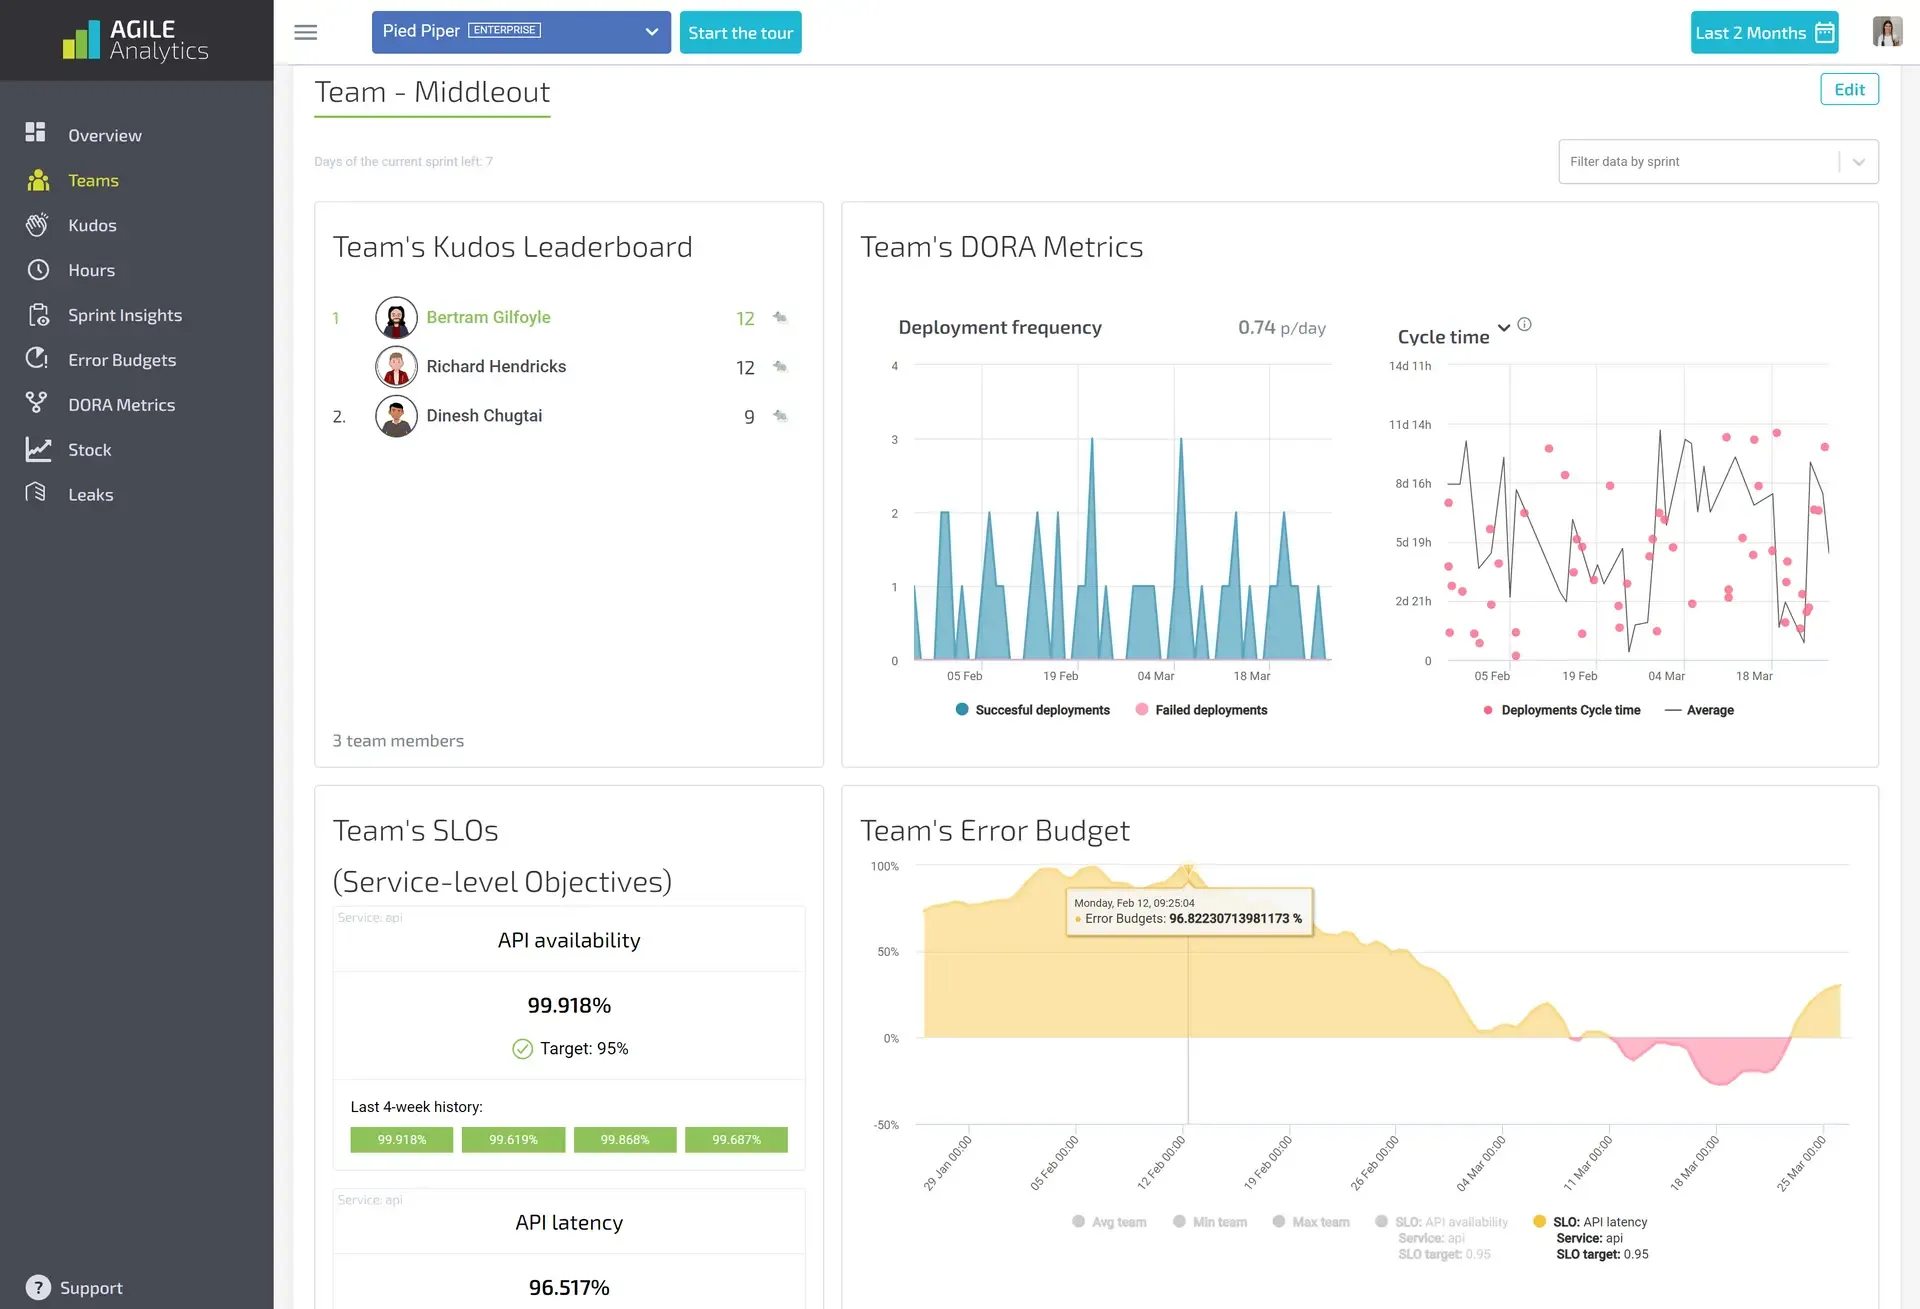
Agile Analytics brings all your data together into one powerful, action-oriented platform — no noise, no guesswork.
🚀 What Makes It Different?
- Data-driven decisions aligned with your teams and processes
- Industry-standard metrics (DORA, SPACE, 4KM)
- Seamless integrations with GitHub, GitLab, Jira, Azure DevOps & PagerDuty
- Centralized insights, always accessible and ready for action
🎯 What You Gain:
- Better decisions based on facts, not gut feeling
- Insight into which teams or components are overloaded
- Improvements in DevEx, efficiency, service levels, and error budgets
No more scattered dashboards or manual spreadsheets — just one platform that truly pinpoints where the issues are.
Developer Support
Speed up delivery — without the noise
Slow development pipelines feel like a black box. Is it the CI/CD pipeline, inefficient handoffs, unreliable tests, or unclear metrics?
We bring clarity, speed, and structure back into your software delivery — hands-on, no generic advice.
🛠 What We Do:
- Optimization of your existing CI/CD pipelines (GitLab, GitHub, Bitbucket, Azure DevOps)
- Debugging and optimizing build and test steps that waste unnecessary time
- Implementing reliable DevEx and Flow metrics in your dashboards
- Guidance based on DORA, 4KM, SPACE, and best practices from dozens of teams
🔍 What It Delivers:
- Faster, more stable builds
- Less wasted time on failed builds & unclear insights
- Accelerated delivery without sacrificing quality
"We saw build times drop from 17 to 6 minutes — without anyone having to work harder. Just smarter."
🧭 Software Development Portal
Everything in One Place, Exactly When You Need It
Too many tools. Too many tabs. Too much searching. Every day, developers lose valuable time looking for documentation, API specifications, or team responsibilities.
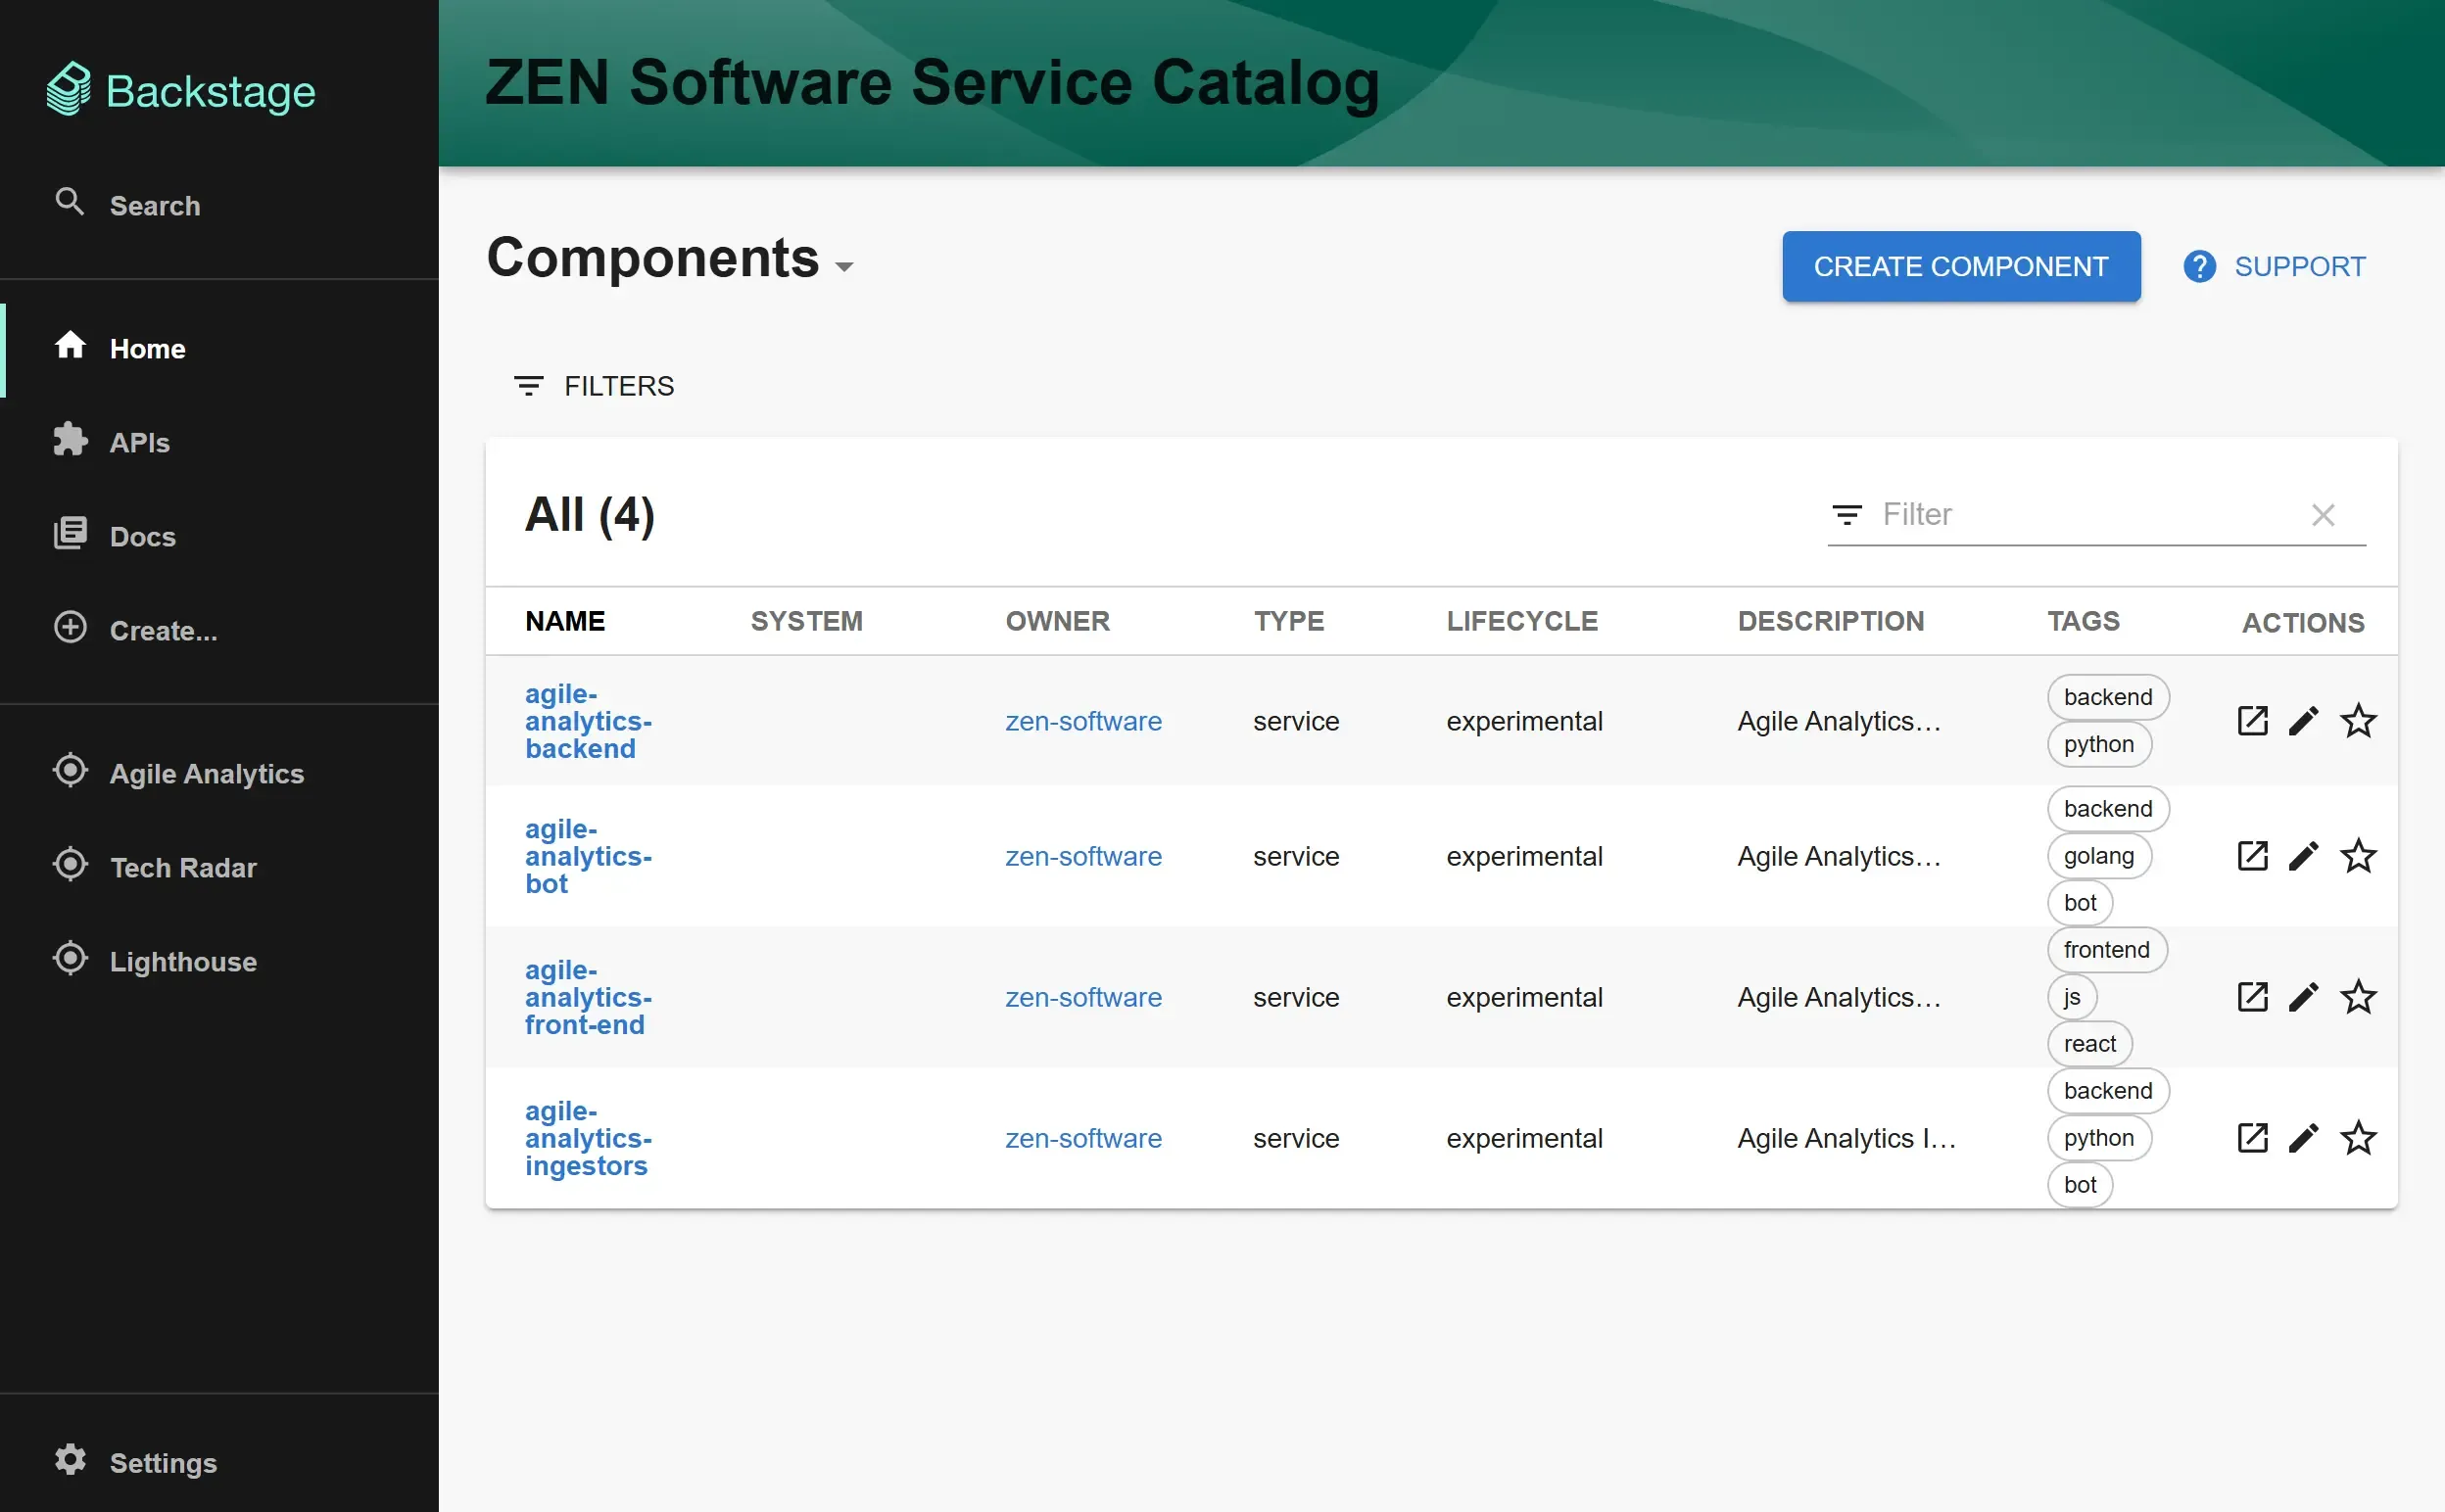
Our Software Development Portal — built on Backstage.io — centralizes everything you need to build, release, and collaborate. No clutter, no wasted time.
🔎 What You Get:
- A single hub for documentation, APIs, teams, services, and status information
- Smart integrations with your existing tools: Git, CI/CD, incident management, monitoring
- A searchable component catalog tailored to your architecture
- Faster onboarding, less context switching, and reduced frustration
🏆 What It Delivers:
- Less lost time per day (30+ minutes per engineer!)
- Faster onboarding for new team members
- Less reliance on Slack questions and ad hoc knowledge sharing
- More focus, efficiency, and productivity in your teams
How to Get Started with Agile Analytics
- Book a Free Consultation
We discuss the challenges your teams are facing and show you where the biggest gains can be made.
- Get instant insight into your bottlenecks
We analyze your development process using data and metrics from tools like GitLab, Jira, and your CI/CD pipelines. You'll see where you're losing time and money — and why.
- Improve DevEx & Accelerate Delivery
Together, we improve your workflow. Whether you choose our SaaS, workshops, or development portal — your team will feel the difference immediately.
Don`t know where to start?
👉 Book a Free Consultation and discover how Agile Analytics can help.
🚀 Become the Team Everyone Wants to Be
You have a feeling that things could be better. But the data is missing. Or you're drowning in it. Builds are slow, collaboration is stalling, and no one knows exactly why.
🔧 You're not alone.
At Maxeda DIY Group (Praxis, Brico), development teams struggled with the same questions: Should we invest in new features, or improve stability first?
"Agile Analytics helps our teams plan better: do we focus on features or invest in stability?"

By applying Agile Analytics, they discovered:
- Where the biggest delays were
- How teams could work smarter in a sustainable way
- Which improvements truly impacted speed, stability, and quality
Most importantly: they regained control and confidence in the development process.
Frequently Asked Questions (FAQ)
Who is Agile Analytics for?
Agile Analytics is for engineering and platform leaders who want to improve developer experience, remove delivery bottlenecks, and drive measurable improvements in how software gets built.
How does Agile Analytics collect data?
We use a mix of AI-powered surveys, developer interviews, and automated metric collection (via integrations with Git platforms, CI/CD systems, and project management tools like Jira). This creates a 360° view of both the technical and human aspects of your software development.
What metrics do you use?
We support industry-standard frameworks like DORA, 4 Key Metrics (4KM), SPACE, Error Budgets, and Service Levels. All are integrated into your dashboards and aligned with your team’s goals.
How is this different from regular DevOps monitoring tools?
DevOps tools tell you what happened. Agile Analytics helps you understand why it happened — and what to do next. We combine hard metrics with qualitative feedback to show which process changes actually improve your DevEx and delivery outcomes.
What results have your clients seen?
Our customers consistently report higher developer satisfaction, faster delivery, and fewer unproductive delays. Agile Analytics helps teams create a feedback loop for continuous improvement that sticks.
How long does it take to see results?
Most teams identify high-impact improvements within the first 2-4 weeks. Full integration of Agile Analytics SaaS and Developer Portal can vary, but typically delivers ROI in under 3 months.
Ready to Transform Your Engineering Team?
Don’t let bottlenecks and inefficiencies hold you back. Agile Analytics gives you the insights you need to deliver results and retain top talent.
Reduced Lead Time
Faster delivery of features and updates to production.
Higher SLO Compliance
Improved reliability and adherence to service objectives.
Lower Deployment Failure Rates
Streamlined pipelines and fewer errors in production.
Enhanced Team Collaboration
Teams work more effectively together, improving alignment and communication.
Boosted Job Satisfaction
Engineers feel more supported, engaged, and motivated.