Effectively measure the DORA metrics with Agile Analytics

Your benefits of measuring DORA metrics
Clear and fair performance data about your software development team
Streamline development processes and increase the value of your software
Create happier developers while increasing engagement and motivation

What are the DORA metrics?
Developing software is an intense job. And it’s often difficult to tell what’s happening in all the systems and tools that we use to develop. But measuring and understanding how your team is performing is essential for running a successful software business. Why? Because you can’t improve what you don’t measure.
So, meet the DORA metrics! Google’s DevOps Research and Assessment team (DORA) identified these metrics after six years of research on software development. They are predictive of software delivery operational performance and crucial to help you build better software faster and run a happier team.
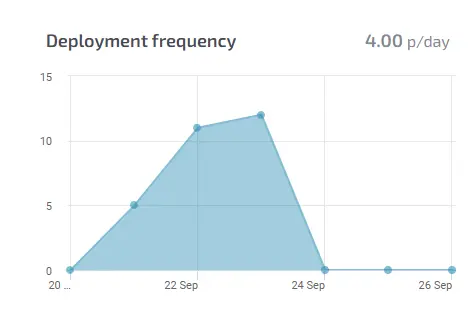
Deployment Frequency (DF)
Refers to the frequency of successful software deployments to production. By measuring deployment frequency, the organisation measures the cadence of the deployment work.
Operational productivity metric
Insights into successful deployments
Track your Software Delivery Cadence
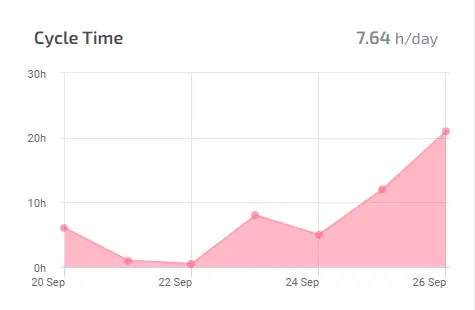
Lead Time for Changes (LT)
Captures the time between a code change commit and its deployable state. This metric is critical for determining the flow of work.
End-to-end monitoring on feature realization
Check your flow from idea to realization
Track Lead Time for delivering value
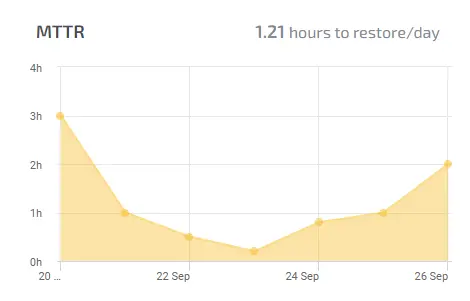
Mean Time to Recovery (MTTR)
Measures the time between an interruption due to deployment or system failure and full recovery.
Measure how fast your team recovers from incidents
Create insight in your Service Level: is it too high or too low?
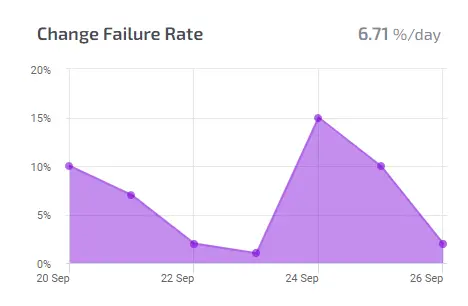
Change Failure Rate (CFR)
Indicates how often a team’s changes or hot fixes lead to failures. This metric indicates the defects that occur when developing software.
Detect and remove brittle deployment procedures
Find out if production incidents were caused by bad deployment
Discover if tests have sufficient coverage and maintain production service level
Year over year, the best software teams keep getting better, and those who fail to improve fall further and further behind.

Track your DevOps performance with DORA metrics in Agile Analytics
To make data driven decisions and improve your performance with DORA, you need to track these metrics continuously and automatically. With Agile Analytics you don’t have to worry about collecting data or spending time piecing together reports. Agile Analytics does all this automatically for you.

More on DORA
DORA metrics in Agile Analytics:
Integrate many data sources into one, clear dashboard
Leverage Aritifical Intelligence
Correlate your Service Level to DevOps performance