AI Observability in Developer Workflows: What the Latest Research Actually Shows

Published on 14 May 2026 by Zoia Baletska
AI has quietly settled into everyday development work. It shows up in code reviews, pull requests, documentation, and all the small decisions that keep things moving. What’s still missing, in many cases, is a clear understanding of what it’s actually doing there.
A recent paper, AI Observability for Developer Productivity Tools: Bridging Cost Awareness and Code Quality, takes a closer look at that gap. Rather than treating AI as something you either “use” or “don’t use,” it looks at how to track it properly—cost, behaviour, and output included—and how that data fits into development workflows.
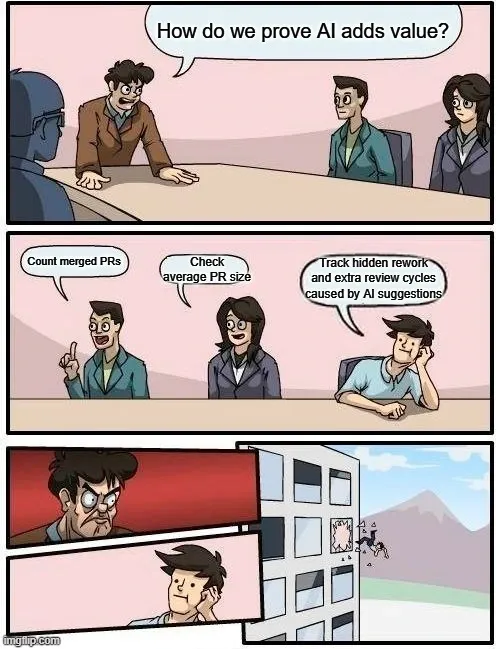
The Problem: Plenty of Usage, Very Little Clarity
Teams today often rely on several AI tools at once. Some are embedded in IDEs, others in review systems, others in standalone tools. Each of them generates data, but it rarely ends up in one place. That creates a familiar situation: you know AI is being used, but not how much it costs overall, how often it’s triggered, or how reliable the outputs really are. There’s no clean way to connect usage with outcomes.
The paper frames this as an observability problem. Not in the traditional infrastructure sense, but in the broader sense of understanding how a system behaves under real conditions.
What the Paper Builds
To explore that idea, the authors built a system that combines two things that are usually separate:
-
a developer-focused dashboard that tracks work like pull requests and AI-assisted reviews
-
an observability layer that captures model usage, tokens, and costs
Instead of running side by side, both feed into the same data model. That shared layer is what makes it possible to look at AI activity in context, rather than in isolation.
The implementation itself is fairly straightforward—FastAPI on the backend, a simple frontend, and integrations with several AI providers—but the structure matters more than the stack.
Seven Patterns That Keep Showing Up
One of the more useful parts of the paper is a set of patterns that came out of the implementation. They’re not abstract ideas; they reflect what had to be built to make the system work:
-
pulling real token usage directly from provider APIs
-
maintaining a pricing registry for different models
-
defining a shared telemetry format
-
aggregating costs into dashboards
-
validating model outputs before they’re used
-
generating summaries with LLMs
-
producing reports from collected data
Taken together, these patterns sketch out what “AI observability” looks like in practice. Not a single tool, but a combination of pieces that fill in different parts of the picture.
What They Actually Ran
This wasn’t limited to a small demo. The system was used with real development activity over several months, including AI-assisted reviews and general usage across tools.
Data came from multiple places:
-
direct API integrations
-
CLI logs from local tools
-
manual entries where automation wasn’t possible
That mix is worth noting. Even with a working system, not everything can be captured automatically.
What Came Out of It
A few results stand out, mostly because they put numbers behind things that are often guessed.
Token tracking turned out to be highly reliable when taken directly from provider APIs. The reported usage matched billing data, which means cost calculations could be treated as accurate rather than approximate.
At the same time, output quality told a different story. A noticeable share of responses—29%—needed some form of cleanup before they could be used. That doesn’t make AI ineffective, but it does change how its contribution should be interpreted.
On the performance side, the system handled queries and dashboard updates quickly enough to be usable in day-to-day work. More importantly, it reduced the effort needed to understand usage patterns. Instead of piecing things together manually, the data was already there.
Another point the paper makes, indirectly, is that no single data source is enough. APIs cover part of the picture, logs cover another, and some gaps still require manual input.
Where the Approach Falls Short
The paper doesn’t gloss over the rough edges.
Some tools don’t expose their usage data at all, which makes automated tracking impossible. In those cases, costs have to be entered manually.
Validation pipelines work well when outputs follow a structured format, but become less reliable with free-form text.
Pricing data isn’t automatically updated, so it has to be maintained over time. And anything based on parsing logs depends on formats that can change without notice.
None of these issues breaks the system, but they do limit how complete the picture can be.
What This Means for Teams Using Agile Analytics
The paper makes one thing clear: AI is no longer a side tool in development. It’s part of how work gets done, and it behaves like any other component in your delivery system—it produces output, consumes resources, and introduces variability.
That has consequences.
Most teams today track delivery performance through familiar signals—cycle time, throughput, and deployment frequency. Those still matter, but they don’t tell you much about how AI is shaping the work behind them. You might see faster reviews or shorter feedback loops, but without visibility into AI usage, it’s hard to tell whether that improvement is real, where it comes from, or what it costs.
The approach described in the paper points in a different direction. By tying AI activity—tokens, cost, outputs—directly to development workflows, it becomes possible to look at things in context. Not just how fast something moved, but what contributed to that speed, and whether it was worth it.
That opens up more grounded questions:
-
Are AI-assisted reviews actually reducing effort, or just shifting it into cleanup?
-
Which parts of the workflow benefit from AI, and which ones don’t?
-
How does AI usage affect cost at the level of a team, a feature, or a sprint?
This is where observability starts to matter in a practical sense, not as another dashboard, but as a way to connect signals that are currently disconnected.
For teams working with Agile Analytics, the implication is fairly direct. If AI is influencing delivery, then it belongs in the same analytical space as everything else—alongside DevEx signals, flow metrics, and operational data. Otherwise, you’re only seeing part of the system.
The paper doesn’t present a finished solution, and it doesn’t try to. What it shows is that once you start measuring AI usage properly, a lot of assumptions become testable. Cost stops being an estimate. Output quality stops being anecdotal. Patterns start to emerge. And that changes how decisions get made.
Supercharge your Software Delivery!
Implement DevOps with Agile Analytics
Implement Site Reliability with Agile Analytics
Implement Service Level Objectives with Agile Analytics
Implement DORA Metrics with Agile Analytics