Can You Really Measure AI Impact on Developers? A Practical Framework

Published on 18 December 2025 by Zoia Baletska
AI-assisted coding tools (like Copilot, AI pull-request reviewers, automated test generators, etc.) are becoming widely adopted — but the evidence for their impact on productivity and developer experience remains mixed. Some recent studies show improvements, others show no change or even slowdowns.
Relying solely on interviews and self-reported developer feedback isn’t enough. Organisations need quantitative, repeatable measures to confidently assess whether AI tools deliver real value — or introduce new risks.
In this article, we propose a practical measurement framework for companies to track AI’s impact on software teams, grounded in publicly available research and adapted for real-world constraints (tooling, privacy, team structure).
Why current research isn’t enough
-
Studies like The SPACE of AI: Real‑World Lessons on AI's Impact on Developers rely heavily on surveys and qualitative feedback. [1]
-
Others — like the 2025 study by METR — found that experienced developers actually became 19% slower when using AI tools on familiar codebases. [2]
-
Some companies report anecdotal gains (e.g. “feels faster coding”), but lack instrumentation to validate if bug rates, review cycles or throughput truly improved.
That’s why companies that want to adopt AI meaningfully — not as a hype, but as a long-term productivity driver — need a data-driven approach.
What you should measure — and how
To capture AI’s impact meaningfully, track metrics across three layers: AI adoption, direct development outputs, and business-level outcomes. A similar layered approach is recommended by thought leaders studying AI in engineering contexts. [3]
Layer
AI Adoption / Usage
Development Output Metrics
Business / DevEx Impact Metrics
Key Metrics & Why They Matter
-
Daily / Weekly / Monthly Active Users (DAU/WAU/MAU) — What percentage of engineers actually use AI tools and how often.
-
Session Depth / Prompt Count per Session — How intensively developers use AI per session (single-line autocomplete vs multi-turn prompt & refactor). Deep usage likely correlates with real productivity gains; shallow usage may reflect noise or exploration.
-
Tool Diversity Index — How many distinct AI tools (code gen, review, test generation, docs, etc.) are used. A broader toolset may hint at mature adoption rather than narrow niche use.
-
Pull Request (PR) Cycle Time — Time from PR creation to merge. A drop suggests that AI helped reduce friction (faster code generation, fewer manual edits, quicker reviews).
-
PR Throughput per Developer / Team — Number of merged PRs per unit time, adjusted for size/complexity. Higher throughput could signal AI effectiveness — but only when normalised properly (see maintainability, quality below).
-
Change Failure Rate / Post-Merge Bug Rate — Are faster deliveries coming with more bugs, rollbacks, or rework? A necessary counterbalance to speed.
-
Revert Rate or “Fix / Rework” Rate — If AI-generated code often needs correction, that adds overhead and reduces net benefit.
-
Code Maintainability / Code Quality Metrics — e.g. complexity, cyclomatic complexity, documentation coverage, test coverage. Helps measure long-term health beyond “just shipping fast.”
-
Developer Experience Index (DXI) or similar composite — regular (e.g. quarterly) survey tracking satisfaction, cognitive load, flow, burnout, and perceived AI helpfulness. Such self-reported data complements hard metrics and helps capture human cost/benefit.
-
Time Spent on High-Value Work (vs. Toil) — Percentage of time spent on feature development, design, innovation versus boilerplate, refactoring, verbose tests, and docs. If AI reduces toil, ideally, more hours go to strategic work.
-
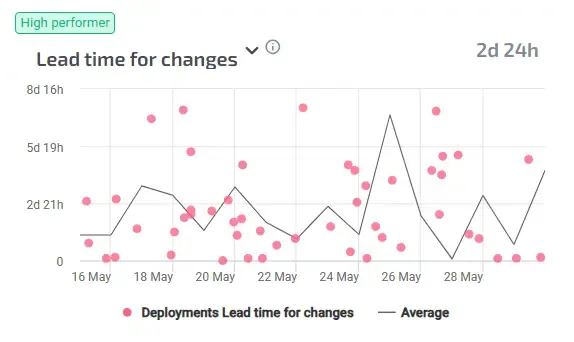
Cycle-to-Release Frequency / Lead Time for Changes — At organisational level: does AI lead to faster releases? Shorter lead times? More reliable deployments? (Often measured via DevOps metrics frameworks.)
-
Operational / Maintenance Cost Over Time — Fewer bugs, fewer hotfixes, less technical debt accumulation — over months, this can yield real savings.
Important notes/caveats:
-
Never judge AI impact on output with a simple raw commit or lines-of-code metric — these are notoriously misleading.
-
Always normalise by complexity or size of change, e.g. using “PR complexity scores” or story point estimates — otherwise AI may appear to help simply by generating lots of small, trivial PRs.
-
Maintain a control group (non-AI users or delayed AI rollout) if possible. Otherwise, improvements may come from unrelated factors (team growth, process change, seasonality).
-
Combine hard metrics with periodic developer feedback — “objective” data misses UX, cognitive load, mental overhead, and AI-specific friction (false positives, overfitting, context mistakes).
Why this works: supporting evidence
-
A recent large-scale empirical study, Intuition to Evidence: Measuring AI's True Impact on Developer Productivity (2025) reports a 31.8% reduction in PR review cycle time, along with major increases in code volume shipped. [1]
-
Still, as METR’s randomised trial showed, AI can also backfire — in their case, experienced developers slowed down by 19% when using AI in familiar codebases. [2]
-
Tools, adoption patterns, team culture, codebase size and complexity — all influence whether AI helps or hurts. That’s why measurement is not optional, but essential.
So, is the AI impact measurable?
Yes — you can measure AI’s real impact on software engineering teams. If you design your metrics carefully, normalise for complexity, and combine quantitative data with developer feedback, you’ll get a realistic view of whether AI tools are creating value or noise.
Given the mixed results in public research, every organisation should treat AI adoption like a controlled experiment, not a hype-based leap.
At Agile Analytics, we built our platform precisely to support this kind of measurement. We link operational metrics (lead time, PR throughput, error budgets, SLOs) with developer feedback — making it possible to see not just if code ships faster, but how it affects developer satisfaction, team health, and long-term maintainability.
If you’re considering adopting AI coding tools — or you're already using them but don’t know if they help — start with measurement. Get the data. See the impact. And dare to ask: is it actually making your team better — or just faster?
Supercharge your Software Delivery!
Implement DevOps with Agile Analytics
Implement Site Reliability with Agile Analytics
Implement Service Level Objectives with Agile Analytics
Implement DORA Metrics with Agile Analytics