How to Align SLOs with User Experience — Beyond Uptime and Latency

Published on 9 April 2026 by Zoia Baletska
Service Level Objectives are often presented as a way to bring clarity to reliability. In practice, many teams end up tracking what is easiest to measure rather than what is most meaningful. Uptime percentages and latency percentiles look precise on dashboards, yet they can give a false sense of confidence. A service can be “up” and still fail users in ways that matter—checkout flows that break halfway through, reports that arrive too late to be useful, or APIs that technically respond but return incomplete data.
The gap between system metrics and user experience is where many SLO strategies lose their value. Aligning SLOs with how users actually experience a product requires a shift in perspective: from measuring components to understanding journeys.
Why Uptime and Latency Are Not Enough
Uptime answers a narrow question: is the system reachable? Latency answers another: how quickly does it respond? Neither tells you whether users successfully achieve their goals.
Consider a typical SaaS product. A user logs in, navigates through several pages, submits a request, and expects a result. Each step may individually meet latency and availability targets, yet the overall journey can still fail due to:
-
Partial errors that don’t trigger system-wide alerts
-
Timeouts in downstream services
-
Inconsistent data across components
-
Broken interactions between services
From a monitoring perspective, everything looks healthy. From a user perspective, the product is unreliable.
This is where traditional SLOs fall short—they measure system health in isolation rather than experience in context.
Start With User Journeys, Not Metrics
Instead of beginning with metrics, it helps to map the critical user journeys your system supports.
These are not abstract flows, but concrete outcomes users depend on. For example:
-
Completing a purchase
-
Generating a report
-
Uploading and processing data
-
Receiving a notification within a specific time
Each journey represents a promise your system makes. Reliability, in this sense, is the system’s ability to keep that promise consistently.
Once journeys are defined, SLOs can be built around whether those journeys succeed and how long they take.
This approach changes the nature of SLIs (Service Level Indicators). Rather than measuring isolated signals like request latency, SLIs begin to reflect end-to-end outcomes.
Choosing SLIs That Reflect Real Outcomes
Effective SLIs for user experience tend to share a few characteristics. They capture whether something meaningful happened, not just whether a system responded.
For example, instead of API latency under 200ms you might measure percentage of successful checkout completions within 3 seconds. Instead of job processing time you might track percentage of reports delivered within 5 minutes of request. These indicators combine correctness, performance, and completeness into a single measure.
Designing them requires thinking in terms of user intent:
-
What does the user expect to happen?
-
What would they consider a failure?
-
How long is too long?
This often leads to SLIs that are slightly more complex to implement but far more useful in practice.
Journey-Based SLOs in Practice
To make this more concrete, consider a few examples of journey-based SLOs across different systems.
In an e-commerce platform, a meaningful SLO might focus on the checkout flow. Rather than tracking individual service uptime, the SLO could measure the percentage of users who successfully complete a purchase within an acceptable time window. This captures the combined behaviour of authentication, inventory, payment processing, and confirmation systems.
In a data platform, the key journey might be report generation. A relevant SLO would measure how often reports are delivered correctly and within a defined timeframe after a request is made. Here, latency alone would not capture delays caused by queueing, retries, or upstream data issues.
For internal APIs, the journey may involve another system, depending on a response to continue its workflow. An SLO could measure the percentage of requests that not only succeed but also meet the timing requirements necessary for downstream processes to function smoothly.
These examples highlight a pattern: the SLO reflects the outcome of multiple components working together, not the performance of a single service.
Handling Composite and “Bucket” SLOs
Once SLOs move closer to user experience, they often become composite by nature. A single journey can fail in different ways:
-
The request fails completely
-
The response is too slow
-
The result is incomplete or incorrect
Treating all failures as equal can hide important signals. This is where composite or “bucket” SLOs become useful.
A composite SLO groups different failure modes under a unified objective, while still allowing teams to understand the breakdown.
For example, a checkout SLO might include:
-
Successful completion rate
-
Completion within acceptable latency
-
No data inconsistencies
Rather than tracking these separately without context, they can be combined into a broader objective that reflects the overall experience, with sub-metrics that explain why failures occur.
Another approach is to define “good”, “acceptable”, and “poor” buckets. Requests that meet strict criteria fall into the “good” category, while slower or partially degraded experiences fall into “acceptable”. This provides a more nuanced view than a simple pass/fail metric.
These models allow teams to balance simplicity and insight—keeping SLOs actionable while preserving visibility into underlying issues.
The Trade-Off Between Precision and Practicality
As SLOs become more aligned with user experience, they also become more complex to define and measure. Instrumentation may require combining data from multiple services, tracking user sessions, or correlating events across systems.
There is a balance to strike. Overly complex SLOs can become difficult to maintain and hard to explain. Overly simple ones risk being ignored because they fail to reflect reality.
A useful approach is to start with a small number of journey-based SLOs for the most critical user flows. These can evolve over time as teams gain confidence in the data and the patterns they observe.
Making SLOs Actionable for Teams
For SLOs to influence behaviour, teams need to see how their work affects user experience.
This is where connecting delivery data with reliability signals becomes important. When teams can trace a degradation in a journey-based SLO back to recent changes, dependencies, or bottlenecks, the metric becomes actionable rather than abstract.
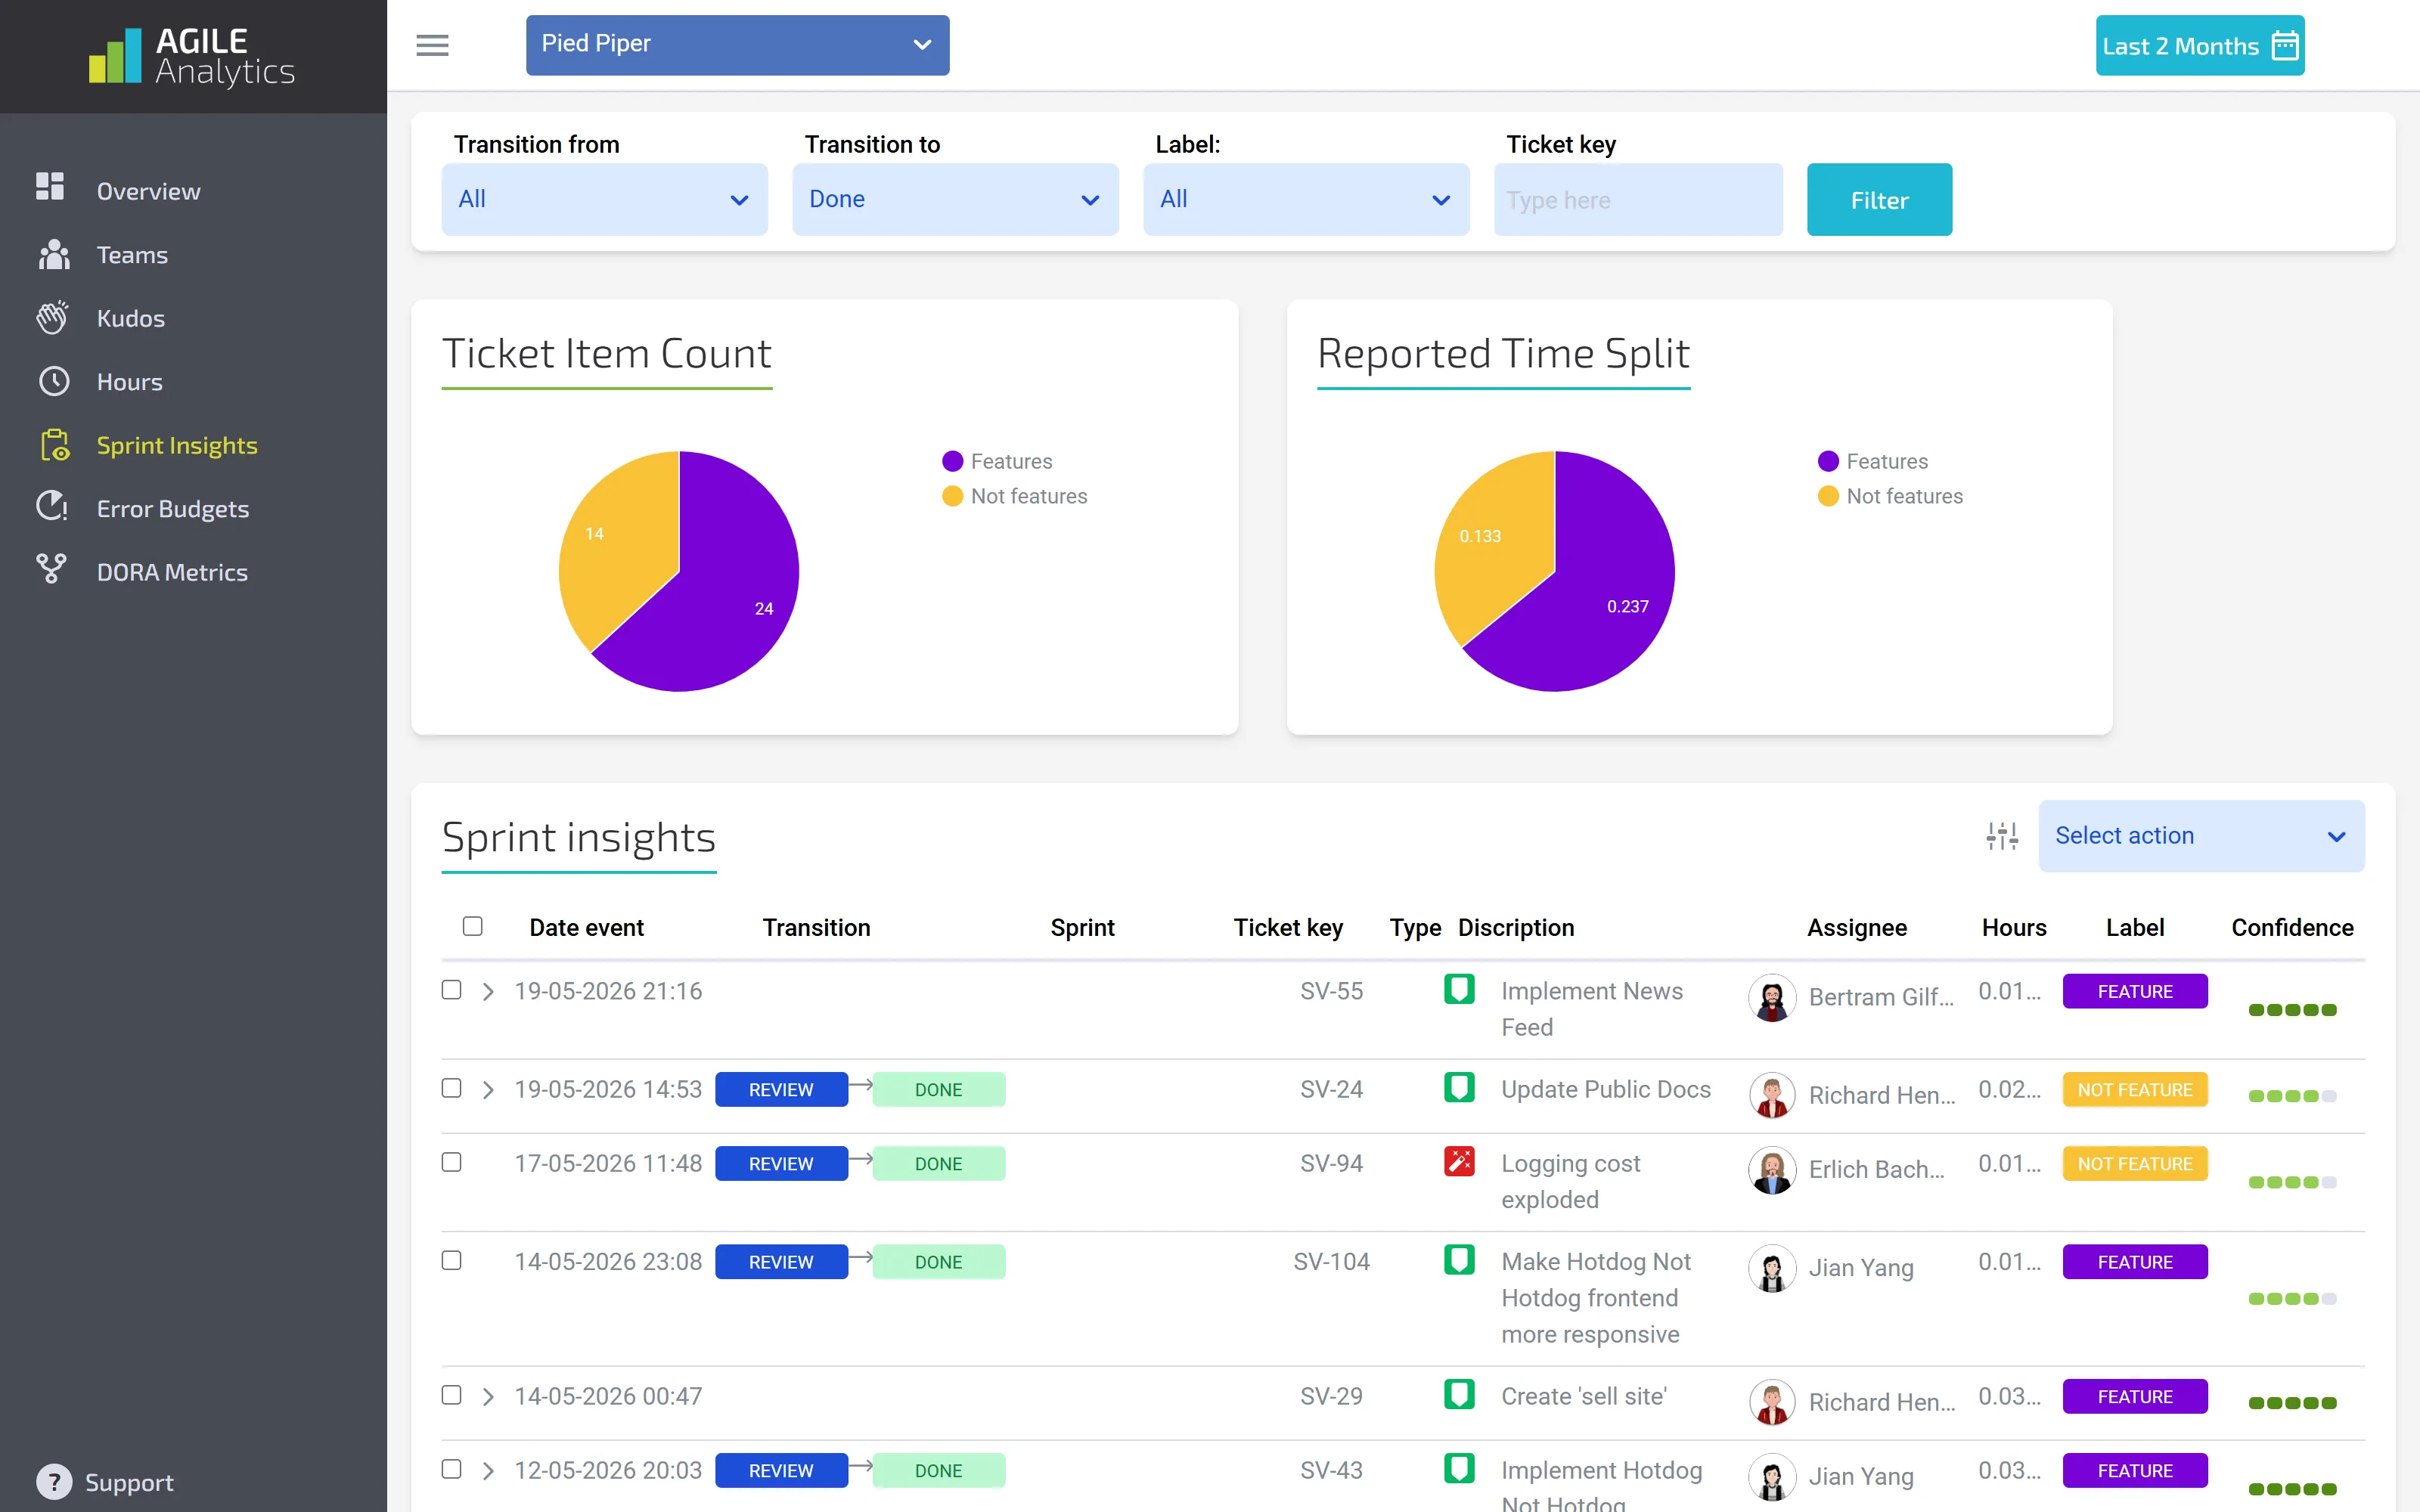
Platforms like Agile Analytics support this by correlating engineering activity with system performance, helping teams understand not just when an SLO is breached, but what likely contributed to it.
This connection closes the loop between development and reliability, turning SLOs into a shared responsibility rather than a separate concern.
A Shift in How Reliability Is Measured
Aligning SLOs with user experience requires moving away from component-level thinking toward a more holistic view of systems.
Instead of asking, “Is the service up?” the question becomes, “Did the user achieve what they came for?”
Instead of measuring isolated metrics, teams begin to evaluate the system as a chain of interactions that either delivers value or fails to do so.
This shift does not eliminate the need for traditional metrics like latency and availability. Those signals remain important for diagnosing issues. But they no longer define success on their own.
When SLOs reflect real user outcomes, they become easier to understand, harder to ignore, and far more useful in guiding decisions.
And that is where they start to deliver on their original promise: helping teams build systems that are not just operational, but reliably valuable.
Supercharge your Software Delivery!
Implement DevOps with Agile Analytics
Implement Site Reliability with Agile Analytics
Implement Service Level Objectives with Agile Analytics
Implement DORA Metrics with Agile Analytics