Meme-Driven Metrics: Why Humour Might Be the Ultimate DevEx Signal

Published on 9 October 2025 by Zoia Baletska
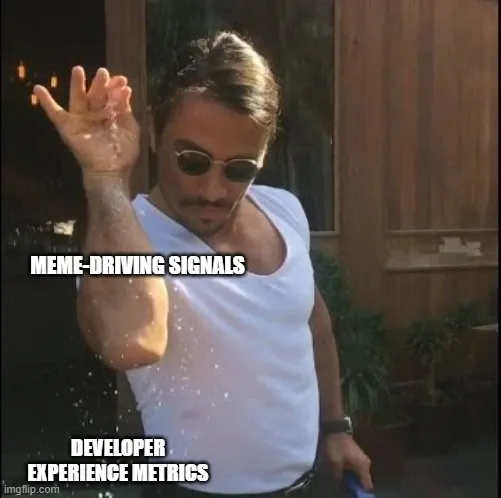
When you think about Agile metrics, what comes to mind? Velocity, cycle time, deployment frequency, maybe even error budgets. But what if we told you that one of the most overlooked signals of Developer Experience (DevEx) isn’t in Jira, Git, or SonarCloud—it’s in memes.
Yes, memes. The Slack screenshot, the “This is fine” dog, the endless parade of SpongeBob reaction images—what your team laughs at might be just as important as what your team commits.
The Hidden Value of Humour in Agile Teams
Developer humour isn’t just a way to pass the time; it’s a real-time barometer of culture and stress levels. Consider these patterns:
-
High frequency of “this pipeline is pain” memes → your CI/CD is probably too slow.
-
Lots of “404 not found” jokes → documentation is likely missing or outdated.
-
“Jira graveyard” memes → workflows may be overloaded with unused tickets.
-
Memes about velocity charts → teams feel pressured by numbers, not outcomes.
Memes surface what people really feel long before it shows up in surveys or attrition data.
Why Humour is a DevEx Signal
-
Early Warning System – Teams often joke about pain points weeks before they escalate into blockers.
-
Safe Expression – A meme can say what a retro sometimes can’t (“We’re drowning in tech debt, but here’s SpongeBob holding it together”).
-
Cultural Pulse – A lively meme culture often correlates with high psychological safety.
-
Collective Coping Mechanism – Shared humour builds resilience during crunch times.
In short, if your Slack channel is dead silent—or only filled with sarcastic memes—that’s data you shouldn’t ignore.
How to Use Meme-Driven Metrics (Seriously)
While we’re not suggesting you replace DORA with Doge, you can learn a lot by measuring humour signals alongside hard metrics:
-
Volume of memes per sprint → compare against spikes in incidents, CI failures, or missed deadlines.
-
Theme clustering → track recurring joke categories (e.g., “pipeline pain,” “deploy Friday,” “Jira graveyard”).
-
Sentiment analysis → yes, even memes can be tagged positive/negative with AI image classifiers or text recognition.
This isn’t about surveillance—it’s about listening. If your team’s humour consistently points to bottlenecks, you’ve got a roadmap for fixing DevEx.
Meme-Driven Metrics + Agile Analytics
At Agile Analytics, we believe in measuring what matters—and sometimes, that means looking outside the usual dashboards. By integrating developer sentiment signals (including surveys, feedback, and yes—even memes) with delivery metrics like DORA, SLOs, and error budgets, you can spot friction points faster and resolve them before they drain your team’s energy.
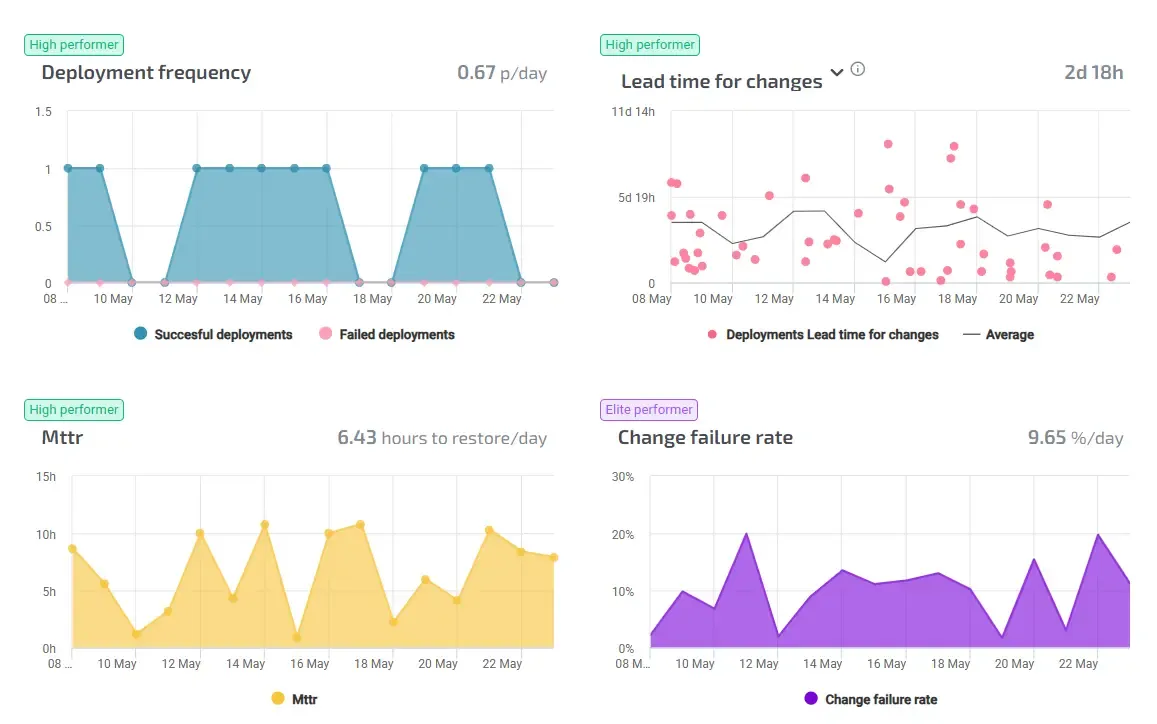
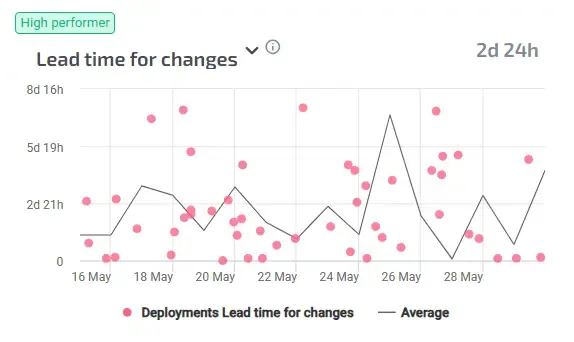
DORA Metrics in Agile Analytics
Because at the end of the day, better Developer Experience isn’t just about fewer bugs or faster deployments—it’s about creating an environment where teams can laugh, collaborate, and thrive.
So next time your Slack channel blows up with “Friday deploy” memes, don’t just laugh—listen. It might be the most accurate DevEx metric you have. From SpongeBob memes to SLO dashboards—why not track both?
Supercharge your Software Delivery!
Implement DevOps with Agile Analytics
Implement Site Reliability with Agile Analytics
Implement Service Level Objectives with Agile Analytics
Implement DORA Metrics with Agile Analytics