The Hidden Costs of Low Deployment Frequency in Modern DevOps

Published on 3 June 2025 by Zoia Baletska
Elite DevOps teams deploy code 46 times more frequently than low performers[1], as revealed by the DORA Accelerate report. This stark difference highlights a crucial performance gap in today's digital world. Top teams deploy their code daily or weekly, while struggling teams manage only monthly or semi-annual deployments.
DevOps success relies heavily on deployment frequency because it shows how well teams handle batch sizes and operate efficiently. Teams that deploy smaller changes more often see faster cycles, quicker feedback, lower risks, and better teamwork. Poor deployment rates usually point to deeper issues. Teams might lack confidence in their production stability, struggle with inter-team communication, or need better automation. Agile Analytics helped organizations spot these bottlenecks and improve their deployment methods. We combined performance metrics with team feedback to create practical strategies that boosted both output and job satisfaction.
Why Low Deployment Frequency Hurts Modern DevOps Teams
DevOps performance suffers when teams don't deploy often enough. This hidden anchor pulls down multiple aspects of performance. The effects go way beyond deployment metrics and affect business results by a lot.
Slower time-to-market and missed business opportunities
Teams that deploy less often can't get their products to market quickly, which hurts their competitive edge. A newer study, published in McKinsey shows that products arriving six months late to market earn 33% less profit over five years[2]. Products released on time but 50% over budget only reduce profits by 3.5%. These numbers show why speed matters more than perfect execution.
Revenue generation also takes longer with slow deployment cycles. Products that need nine months to release might not bring in real money for 18 months. Teams can spot these slowdowns with our Agile Analytics platform. It connects operational metrics with team feedback to show how delays in deployment directly hurt business results.
Higher risk of large-scale failures from big batch changes
Here's something unexpected - deploying less often actually makes things riskier. Big, infrequent deployments are nowhere near as easy to test, review, and fix. Microsoft's operational excellence guidelines tell us that "frequent small deployments are preferable to infrequent large deployments". They say this because "small changes are easier to resolve when issues arise".
To name just one example, see the recent CrowdStrike ordeal that affected 8.5 million Windows computers and led to almost 10,000 flight cancelations worldwide. This disaster shows what can happen when large-scale deployments go wrong.
Increased technical debt and maintenance overhead
Low deployment frequency points to and makes technical debt worse. Stripe's Developer Coefficient study shows that average developers spend 13.5 hours each week dealing with technical debt[3]. So this extra work slows teams down, which leads to longer lead times and even fewer deployments – creating a downward spiral.
Technical debt makes deployments harder as developers face:
-
Unexpected bugs that need workarounds
-
Complex integrations throughout the codebase
-
Bottlenecks in daily work
These problems grow exponentially if nobody fixes them, and development eventually stops completely. This cycle of infrequent deployments feeds itself until teams make basic changes to break free.
Operational and Cultural Impacts of Infrequent Deployments
People and processes face deep effects beyond just numbers. Development teams' mindset and workflow changes drastically due to sparse deployments.
Developer frustration and reduced ownership
Development teams go through "roller coaster feelings" during long release cycles[4]. The tension becomes obvious on deployment days. Teams spend days getting ready, worry about bugs, and feel relieved just to survive - this shows how rare deployments take a mental toll. On top of that, this pattern breaks developer ownership. Engineers lose touch with their code's actual effects because they rarely participate in production environments. Our Agile Analytics platform showed how delayed feedback loops hurt accountability and job satisfaction by linking team sentiment to deployment metrics.
Siloed workflows and poor cross-team visibility
Rare deployments make team isolation worse. Development teams rush to deliver features while operations teams resist changes to keep systems stable. This natural conflict creates rigid boundaries with sparse deployments. Teams focus on different goals, which reduces visibility. Developers miss operational context while operations lacks development knowledge. Leaders struggle to track important initiatives because these hidden barriers create misalignments that grow worse over time.
Lack of live feedback from production environments
Teams lose vital connections to real-life conditions without regular production deployments. Code becomes harder to fix when engineers rarely debug production issues. Small problems grow into major bottlenecks because feedback cycles take too long. Our Agile Analytics platform connects operational metrics with team feedback to solve this gap. Organizations can see important links between reliability and satisfaction. Teams get applicable information to improve both deployment frequency and developer experience through this mix of numbers and team insights.
Connecting Metrics to Meaningful Action with Agile Analytics
Raw metrics mean little without connecting them to real improvements. DevOps teams that struggle with deployment frequency need to connect their numbers to action by combining technical data with human experience.
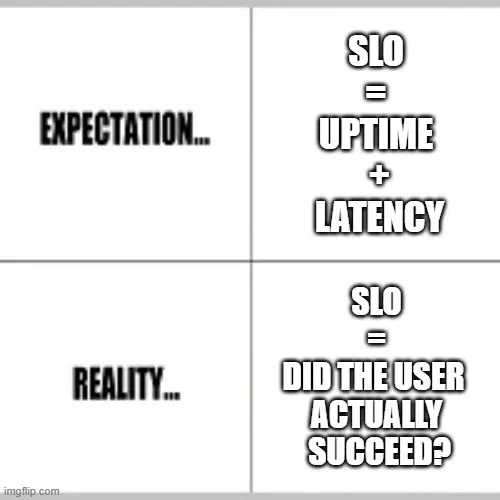
Bridge data and experience: Combining SLOs with team feedback
Service Level Objectives (SLOs) are the foundations of evidence-based reliability decisions that form the core of effective DevOps practices. Teams can't prioritize engineering work without SLOs. Numbers alone don't paint the full picture. Fannie Mae's team found that there was a 4.9% boost in squad productivity over three sprints when they combined quantitative measurements with team context. SLOs help DevOps teams line up technical performance with business goals while creating a buffer for customer-facing Service Level Agreements.
Highlighting correlations between reliability and team satisfaction
Studies show DevOps implementation boosts teamwork quality by 75.6%. This reveals a clear connection between technical practices and team satisfaction. Teams that use deployment frequency as a leading indicator see improvements in many areas:
-
Teams split work into manageable chunks more effectively
-
Cycle times drop by almost 50% for most work items
-
Work-in-progress limits cut down context switching and overwhelm
Our experience with Agile Analytics shows that connecting deployment frequency metrics with team sentiment gives better insights than looking at either metric by itself.
Turning insights into actions: Reducing bottlenecks and boosting productivity
The first step is to spot bottlenecks. These often hide in manual processes that teams think need human involvement. Fannie Mae saw platform usage jump by 481% [link_2] after adding a self-service interface for code scanning. Our Agile Analytics platform helps teams find workflow constraints by connecting metrics like lead time and SLOs with developer experience data.
The hardest bottlenecks to spot often look like essential process steps, such as approval workflows or manual test analysis. Organizations can set the right priorities by looking at these hidden constraints along with team sentiment data. This approach optimizes both deployment frequency and developer satisfaction, creating positive cycles of continuous improvement.
Building a High-Frequency Deployment Culture
Teams need technical and cultural progress to reshape their deployment practices. High-frequency deployment requires more than just tools. Teams must change their approach to development, testing, and collaboration.
Adopting test-driven development and trunk-based workflows
Test-driven development (TDD) builds quality from the start with tests created before actual code. Teams that use this approach write better software and reduce defects by 30-40%[5]. Trunk-based development works well with TDD. Developers make small, frequent updates to a core "trunk" branch. Elite teams that meet reliability targets are 2.3 times more likely to use trunk-based development than others. These practices promote code ownership and reduce integration issues.
Using deployment frequency as a leading KPI
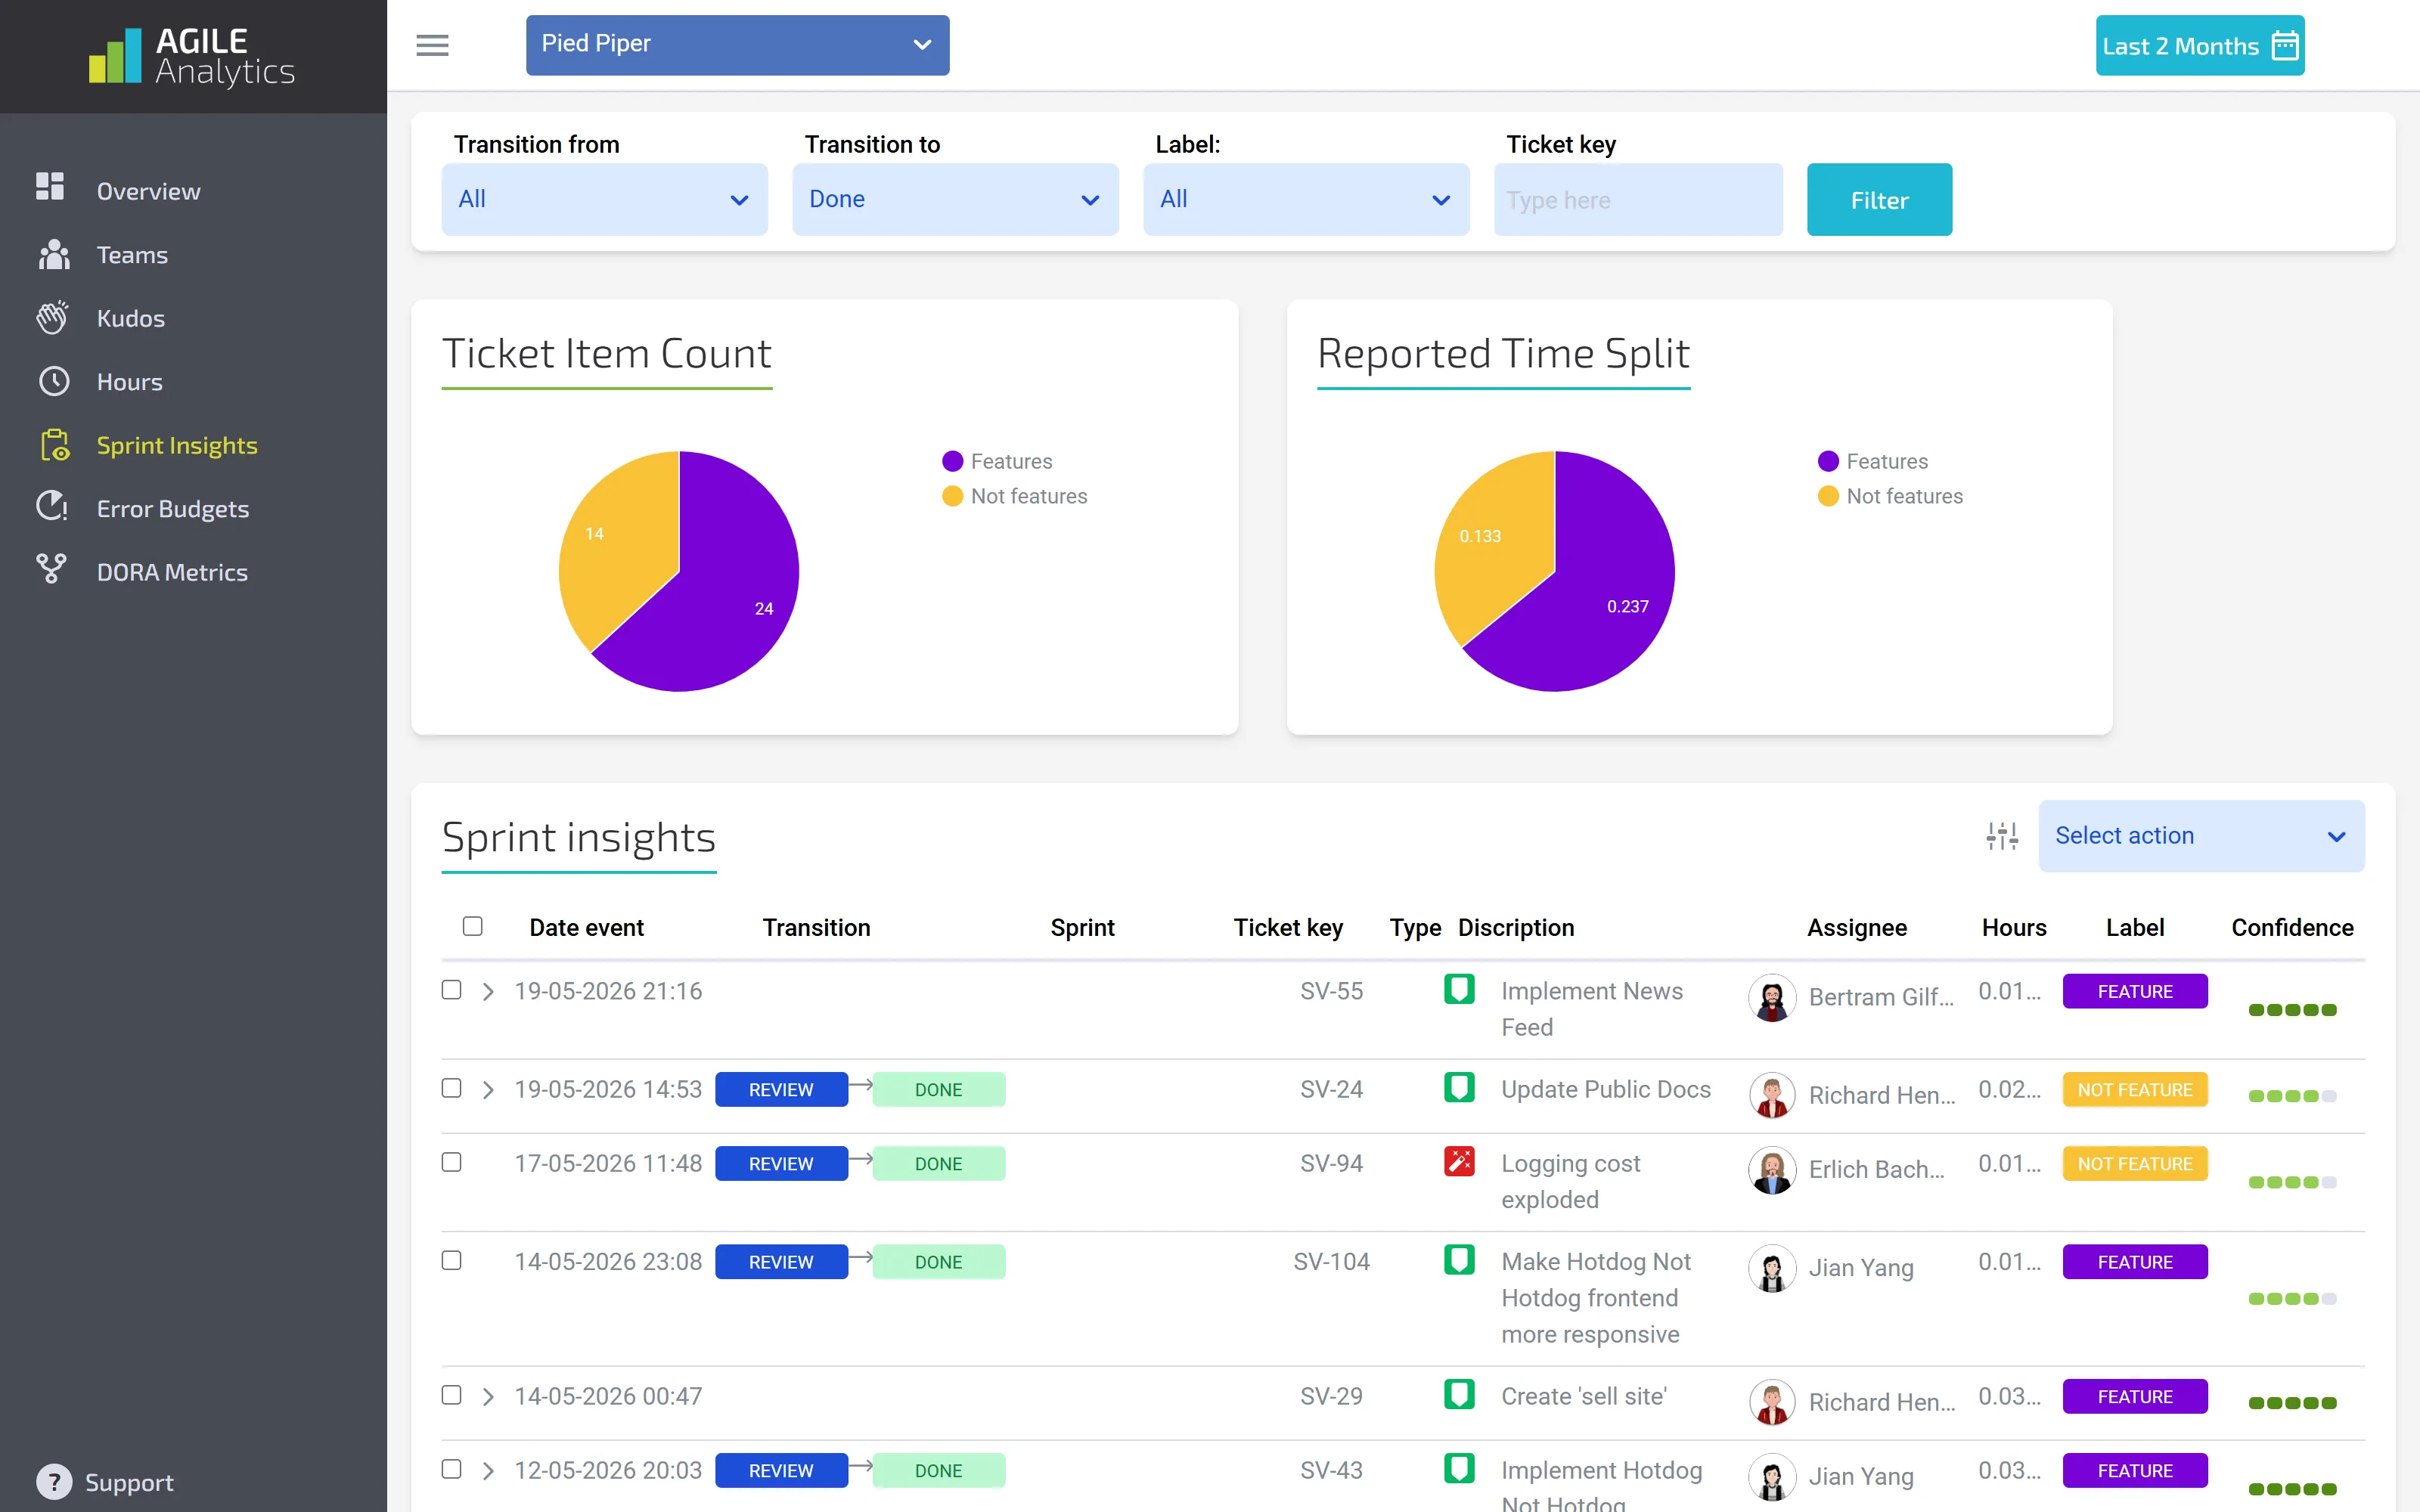
Deployment frequency shows how healthy DevOps really is. Production code changes reveal team capabilities, system performance, and overall flexibility. Our Agile Analytics platform connects deployment frequency metrics with team sentiment data. This gives practical insights about bottlenecks. Organizations can identify improvement areas by understanding the relationship between operational metrics and team feedback.
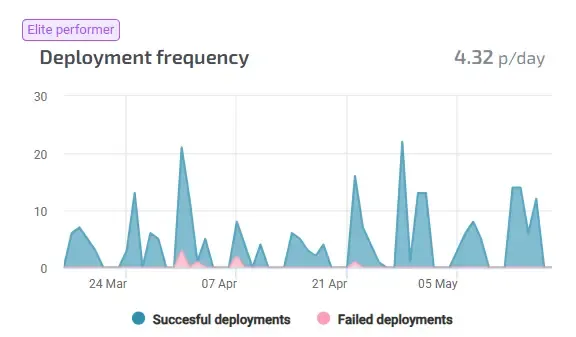
Setting realistic goals based on DORA benchmarks
DORA metrics show elite performers deploy code on demand — often multiple times daily. Lower performers might deploy weekly or monthly. The best approach starts with your current baseline and sets step-by-step targets. Google's research shows elite teams deploy code 208 times more frequently than low performers[6]. Teams should take small steps toward improvement rather than trying to reach elite status immediately.
Continuous improvement through measurement and retrospectives
Teams benefit from regular retrospectives. These meetings help them reflect and make their processes better. Each meeting should end with clear next steps. Teams that hold retrospectives see up to 27% better performance over time. They also experience 23% increased productivity with 15% fewer project delays. Regular measurement and adaptation help teams build the skills needed for consistent high-frequency deployment.
Conclusion
Through collaboration with Agile Analytics, we've showed time and again that organizations do better when they connect operational data with team feedback. This powerful platform helps find bottlenecks and shows links between reliability metrics and team satisfaction. These insights turn into real improvements. To cite an instance, teams using Agile Analytics often find deployment bottlenecks hiding in manual processes that can be automated. This boosts both deployment frequency and developer satisfaction.
High-frequency deployment needs careful steps rather than sudden changes. Start by checking your current deployment frequency. Next, set realistic goals based on DORA standards. Test-driven development and trunk-based workflows build quality and teamwork into your process. Regular retrospectives help track progress by connecting technical metrics with team experiences.
Low deployment frequency costs will keep affecting organizations that ignore this critical DevOps capability. We urge you to start measuring your deployment frequency now and think about how Agile Analytics could help turn your deployment practices from a headache into a competitive edge.
Supercharge your Software Delivery!
Implement DevOps with Agile Analytics
Implement Site Reliability with Agile Analytics
Implement Service Level Objectives with Agile Analytics
Implement DORA Metrics with Agile Analytics