What are Service Level Objectives (SLOs) and why should I measure them?

Published on 23 November 2023 by Zoia Baletska
Have you ever wondered why some software applications perform better than others? The answer is simple: they have well-defined Service Level Objectives (SLOs).
SLOs in Agile Analytics
SLOs are a critical component of Site Reliability Engineering (SRE) that defines the target level of service quality that a system should provide. I will explain what SLOs are, why they are important and provide examples of common SLOs.
SLOs, or Service Level Objectives, are specific, measurable goals that help software development teams ensure that their systems are functioning correctly and efficiently. The main purpose of SLOs is to set a threshold of acceptable service quality for a system, which is usually expressed as a percentage of uptime or response time. By measuring system performance against SLOs, teams can determine whether their systems are meeting their target service levels or need improvement.
Service Level Objectives (SLOs) are measurable goals that define the desired level of performance for a service. Different types of SLOs can be defined based on various aspects of service performance. Here are some common types:
Availability SLOs:
- Definition: These SLOs measure the percentage of time a service is available and operational.
- Example: Achieving 99.9% availability means the service is allowed to be down for a maximum of 8.76 hours per year.
Latency SLOs:
- Definition: Latency SLOs focus on the time it takes for a service to respond to a request or perform a specific action.
- Example: A latency SLO might specify that 95% of requests should be processed in under 100 milliseconds.
Throughput SLOs:
- Definition: Throughput SLOs measure the number of operations a service can handle within a specified time frame.
- Example: Ensuring a web service can handle 1000 requests per second without degrading performance.
Error Rate SLOs:
- Definition: These SLOs focus on the percentage of requests that result in errors or failures.
- Example: Keeping the error rate below 0.5% indicates a high level of reliability.
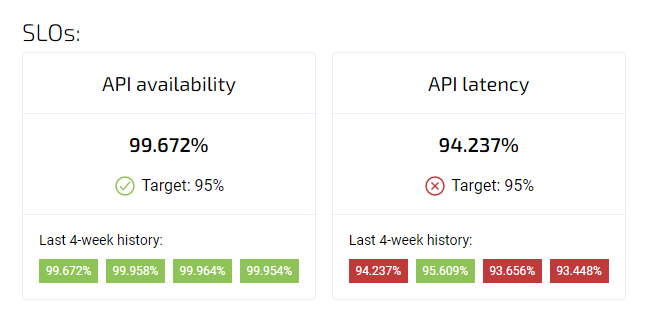
Two of the most common SLOs are availability and latency. Let’s take a closer look at them and configure them in Agile Analytics.
Agile Analytics allows you to easily set up and manage Service Level Objectives for your services and alert when an SLO is out of target or when the corresponding Error Budget is depleted.
Availability SLOs
An Availability SLO defines the minimum acceptable level of uptime for a service over a given period. For example, an e-commerce website may have an availability SLO of 99.9%, meaning that the website should be up and running at least 99.9% of the time each month. Availability SLOs are crucial for ensuring that customers can access the service when they need it and can help teams prioritize efforts to improve uptime.
Set up tracking an Availability SLO in Agile Analytics is easy
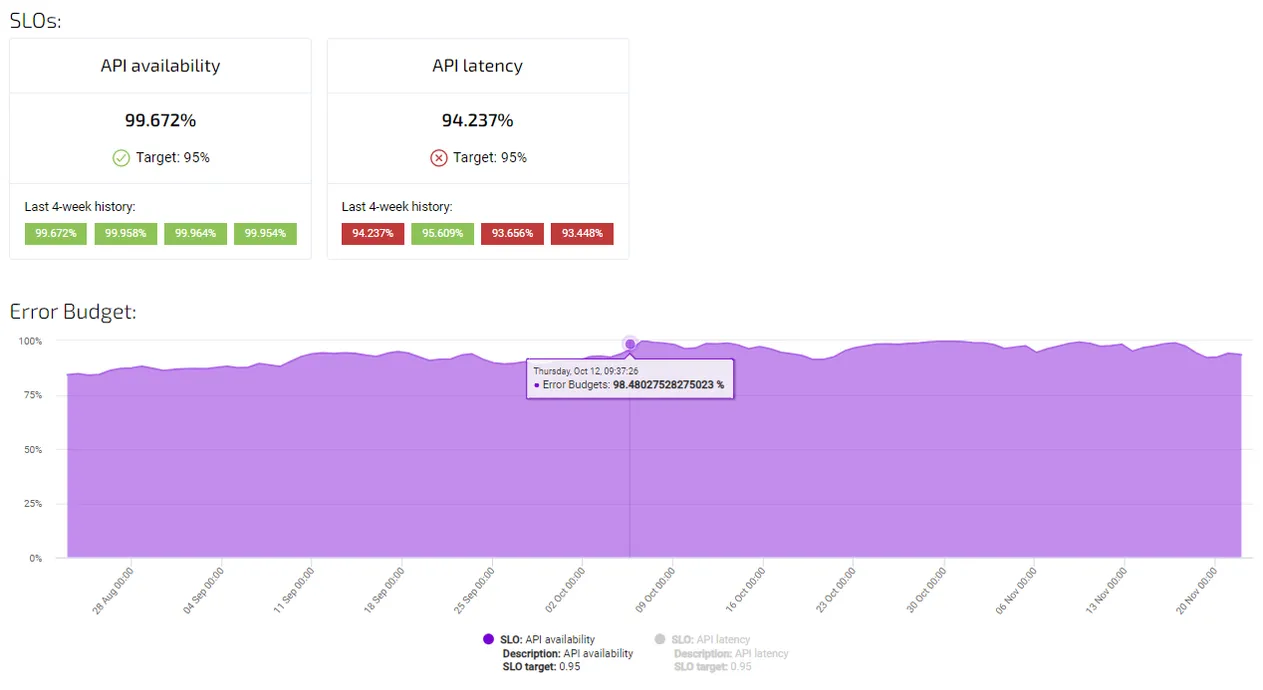
tracking availability SLO in Agile Analytics
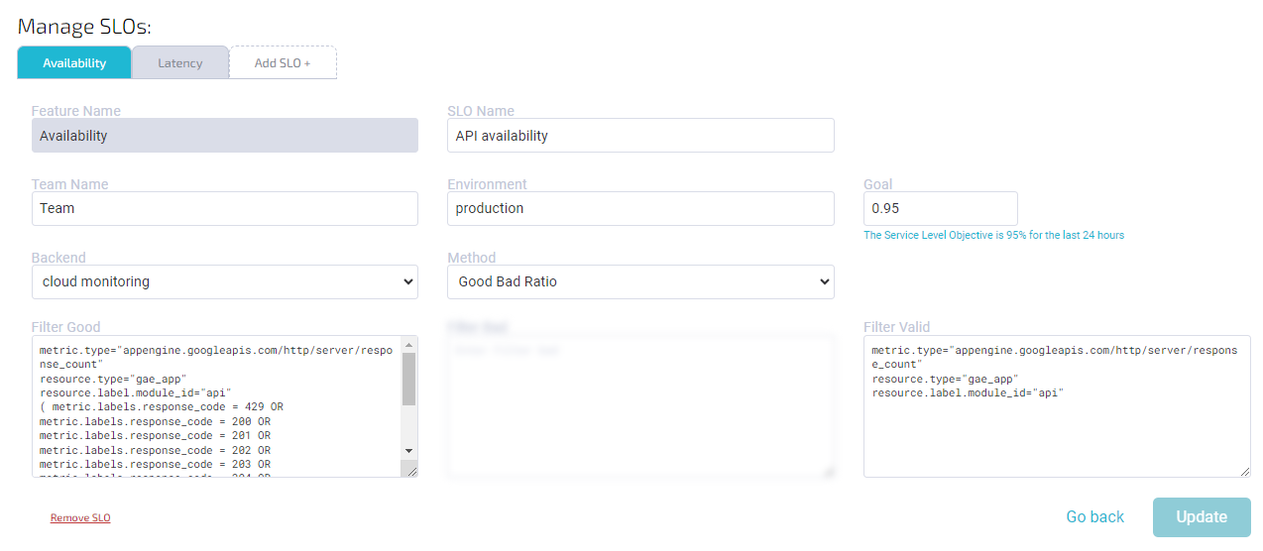
Common filters to measure availability (good-bad ratio):
Filter good:
1 2 3 4 5 6 7 8 9 10 11 12 13 14 15 16project="google-project-name" metric.type="appengine.googleapis.com/http/server/response_count" resource.type="gae_app" resource.label.module_id="module-name" (metric.labels.response_code = 429 OR metric.labels.response_code = 200 OR metric.labels.response_code = 201 OR metric.labels.response_code = 202 OR metric.labels.response_code = 203 OR metric.labels.response_code = 204 OR metric.labels.response_code = 205 OR metric.labels.response_code = 206 OR metric.labels.response_code = 207 OR metric.labels.response_code = 208 OR metric.labels.response_code = 226 OR metric.labels.response_code = 304)
Filter valid:
1 2 3 4project="google-project-name" metric.type="appengine.googleapis.com/http/server/response_count" resource.type="gae_app" resource.label.module_id="module-name"
Latency SLOs
A Latency SLO defines the maximum acceptable response time for a service. For example, a banking application may have a latency SLO of 500ms, meaning that the application should respond to user requests within 500ms or less. Latency SLOs are essential for ensuring that services are responsive and fast, which can help improve user experience and satisfaction.
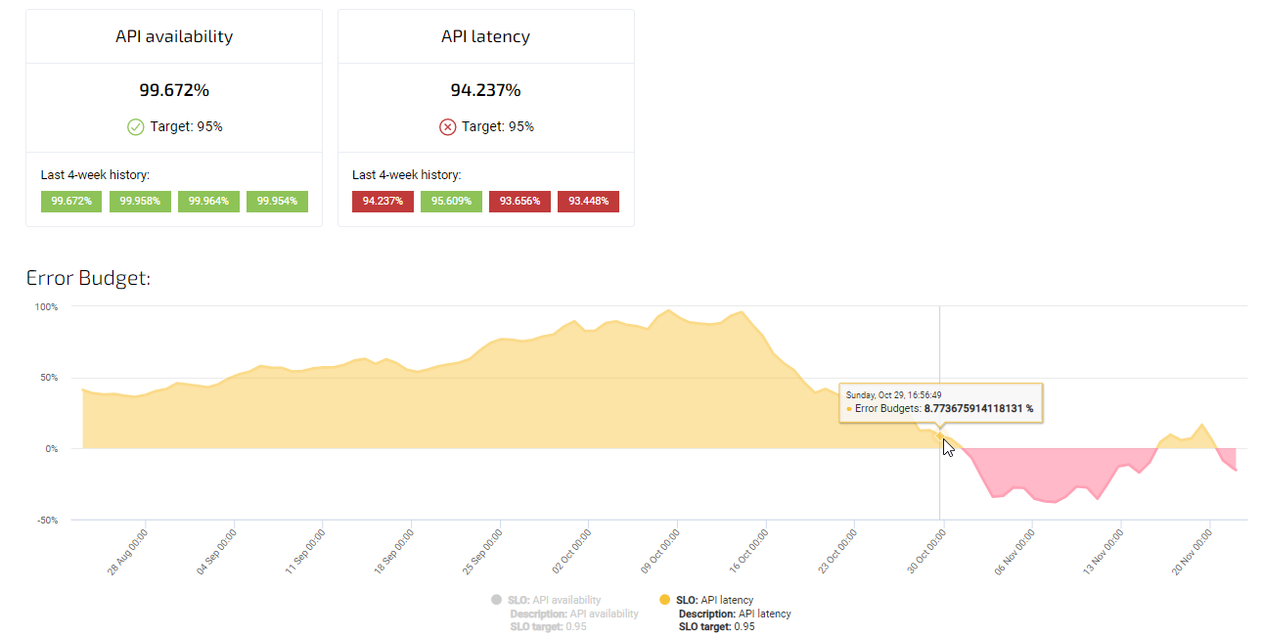
tracking latency SLO in Agile Analytics
Setting up a Latency SLO in Agile Analytics is super easy
Here is a common Latency SLO (Distribution cut) setup in Agile Analytics:
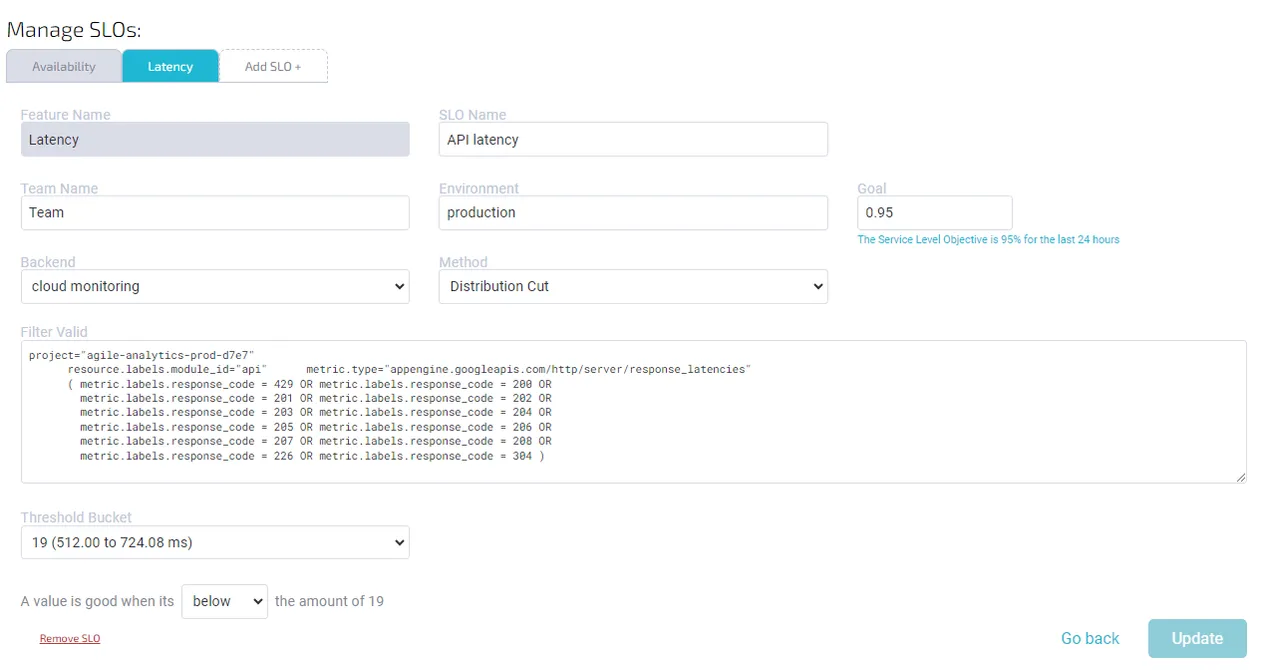
Filter valid:
1 2 3 4 5 6 7 8 9 10 11 12 13 14 15project="google-project-name" resource.labels.module_id="module-name" metric.type="appengine.googleapis.com/http/server/response_latencies" (metric.labels.response_code = 429 OR metric.labels.response_code = 200 OR metric.labels.response_code = 201 OR metric.labels.response_code = 202 OR metric.labels.response_code = 203 OR metric.labels.response_code = 204 OR metric.labels.response_code = 205 OR metric.labels.response_code = 206 OR metric.labels.response_code = 207 OR metric.labels.response_code = 208 OR metric.labels.response_code = 226 OR metric.labels.response_code = 304)
Threshold bucket: 19 Good Below Threshold: True
Conclusion
“Measuring things brings knowledge” – Dutch proverb.
In the end, it's crystal clear that SLOs are a crucial part of keeping your software services up and running like a champ. With the top dogs being availability and latency, you can quickly measure how much time your service spends being a couch potato and how quickly it jumps into action when someone needs it. With Agile Analytics, you can track SLOs faster than Usain Bolt running the 100m dash, get instant insights into what's going on, and transform your services into a lean, mean performance machine. So, what are you waiting for? Try out the 60-day free trial of Agile Analytics and get your software services in tip-top shape today!
Implement Service Level Objectives
Set up Service Level Objectives using best practices and easy-to-use dashboards. Be up and running in no-time with Agile Analytics.


