
Agile Analytics is a platform for measuring how software teams actually deliver. It connects to the tools your teams already use — Git (GitHub, GitLab, Bitbucket), project management (Jira, Azure DevOps), CI/CD, monitoring (AWS CloudWatch, Google Cloud Monitoring, Azure Monitor) and chat (Slack, Teams) — and turns that data into metrics per team: DORA metrics, error budgets and sprint insights. Nothing is entered by hand and nothing rests on opinion. Quality gate meetings and sprint reviews too often run on HiPPO — the Highest Paid Person’s Opinion — and in 2026 the question at that table is usually the same one: our developers code with AI, so why isn’t delivery faster, and is quality holding? Agile Analytics answers it from your own data. Stop guessing; start measuring.
Sprint Insights
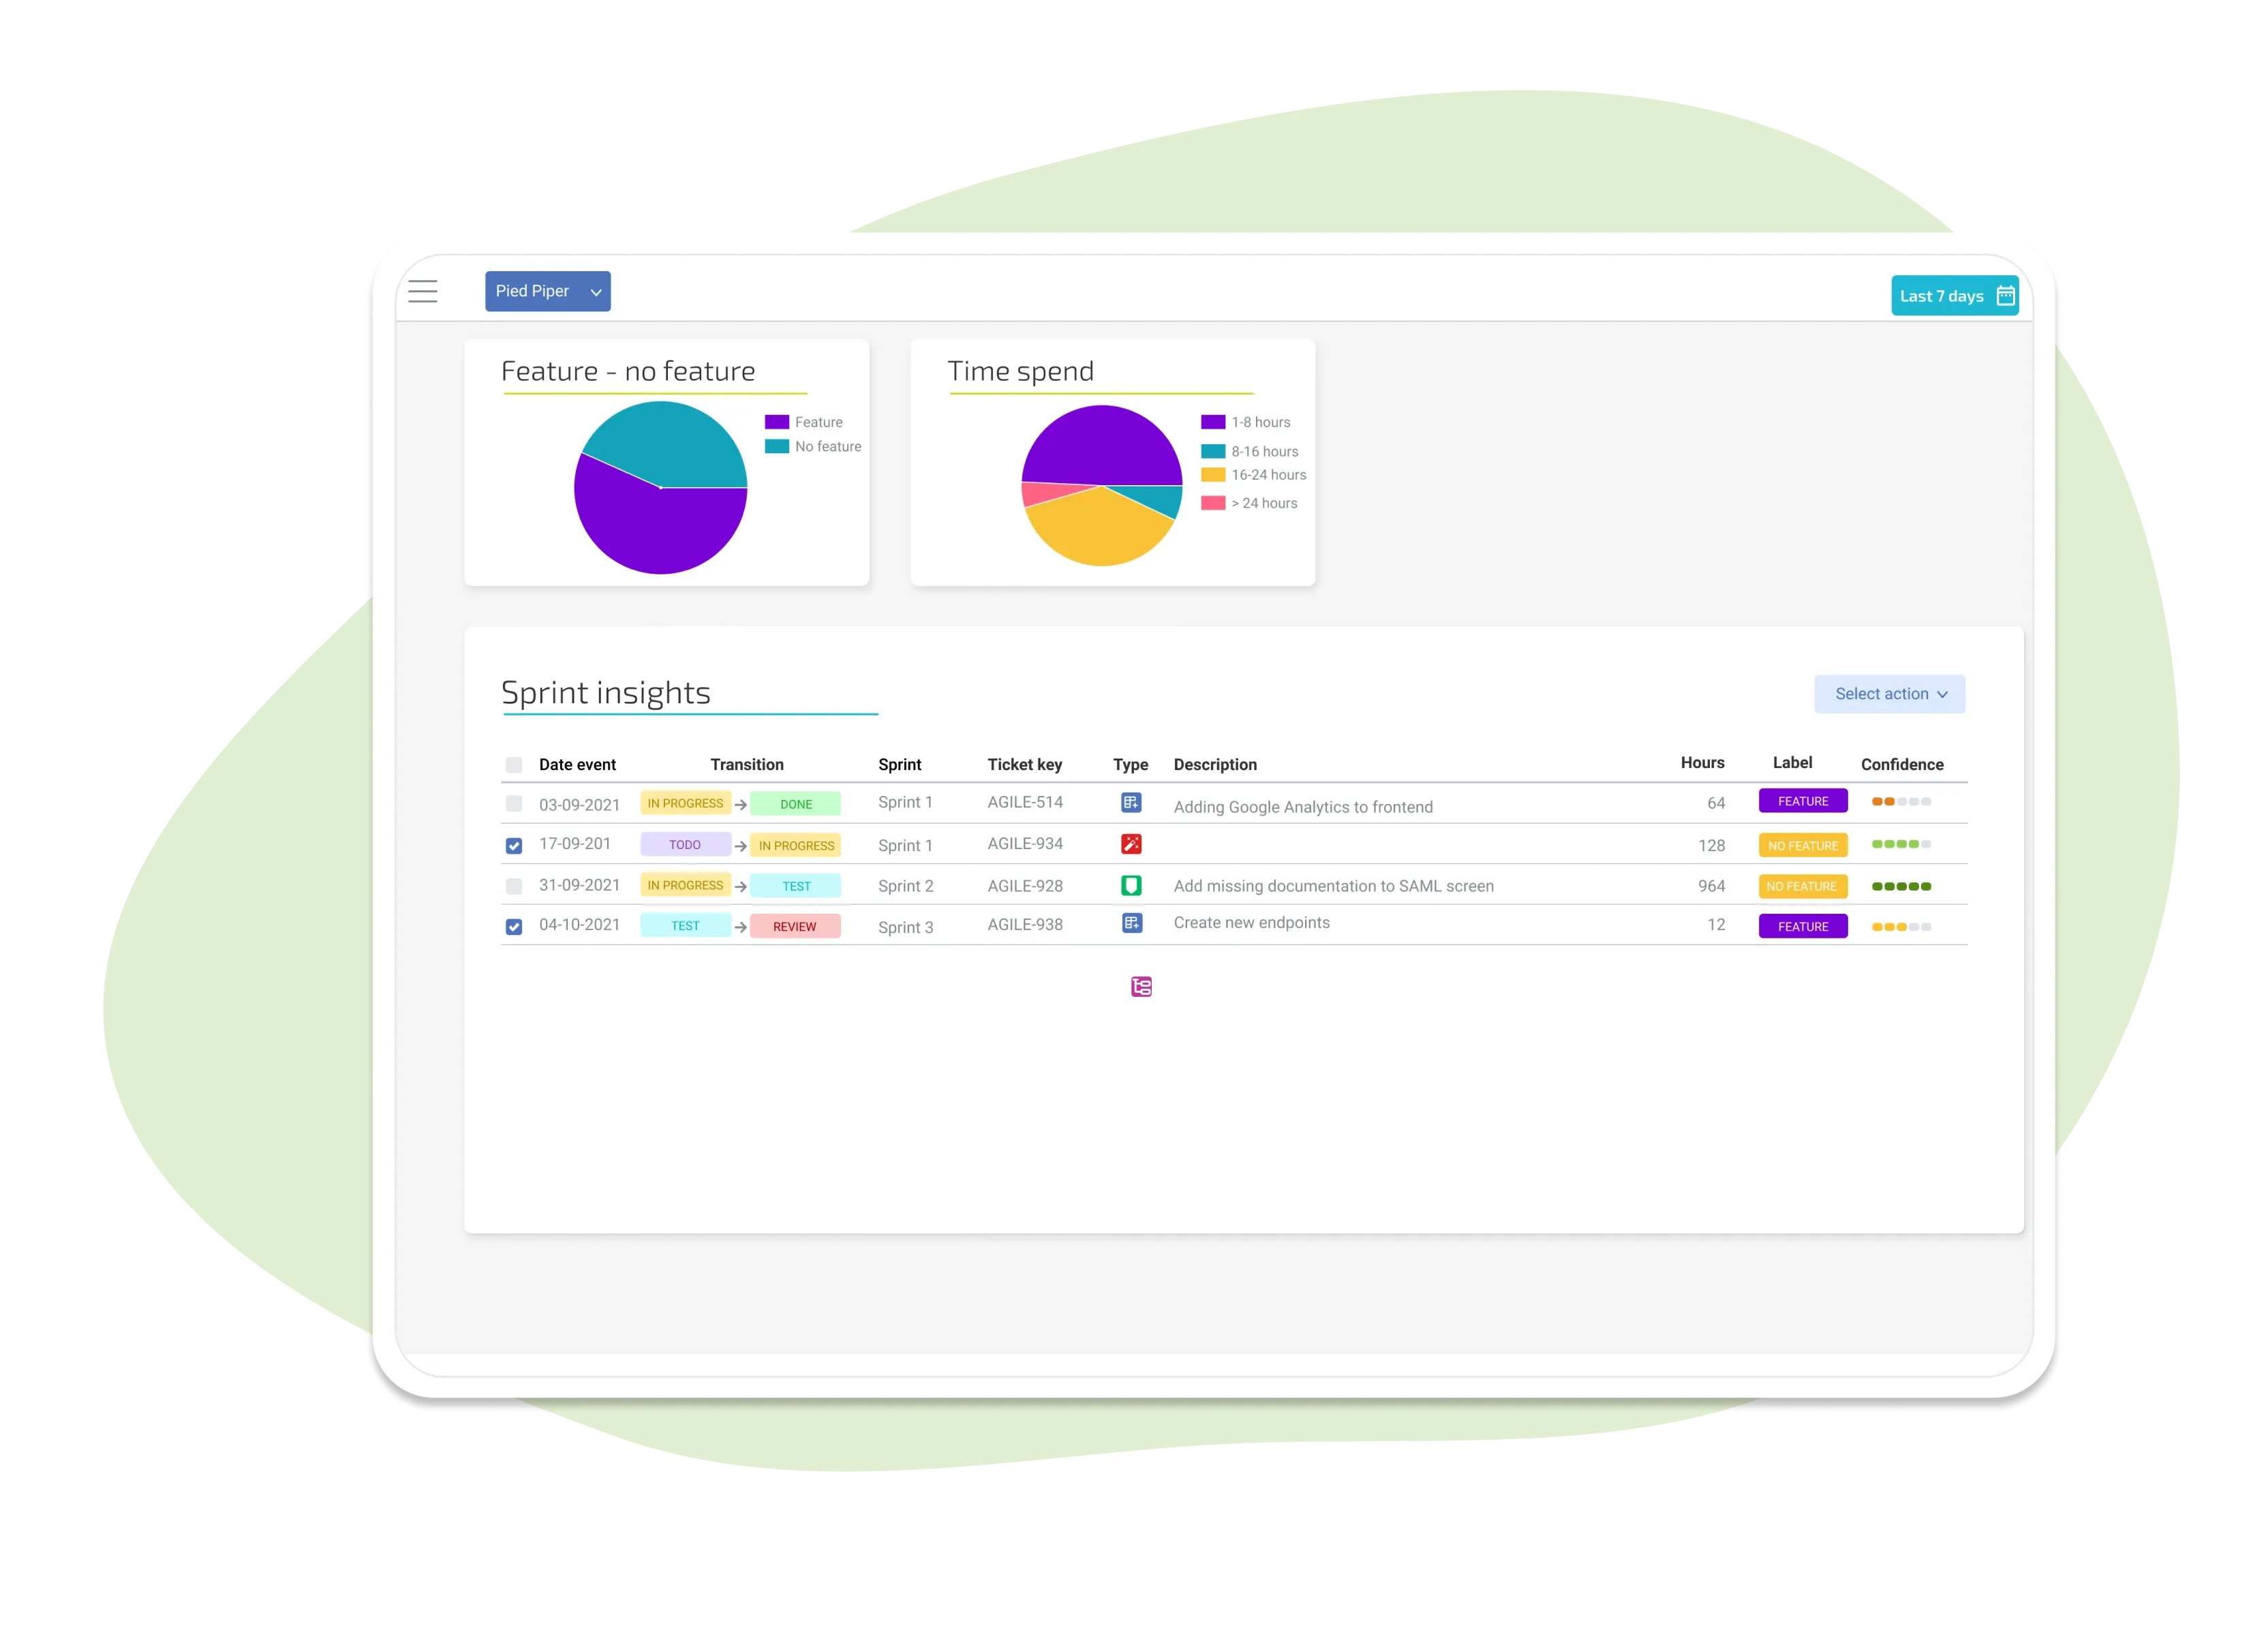
Sprint Insights are powered by Large Language Models and GPT and help teams can gain valuable insights into the distinction between feature development and maintenance/non-feature work. It enhances team autonomy by providing objective measures of the time allocated to each type of work. This knowledge empowers teams to prioritize effectively, optimize resource allocation, and ensure a balanced focus on both feature development and maintenance, ultimately improving productivity and delivery outcomes.
Error Budgets
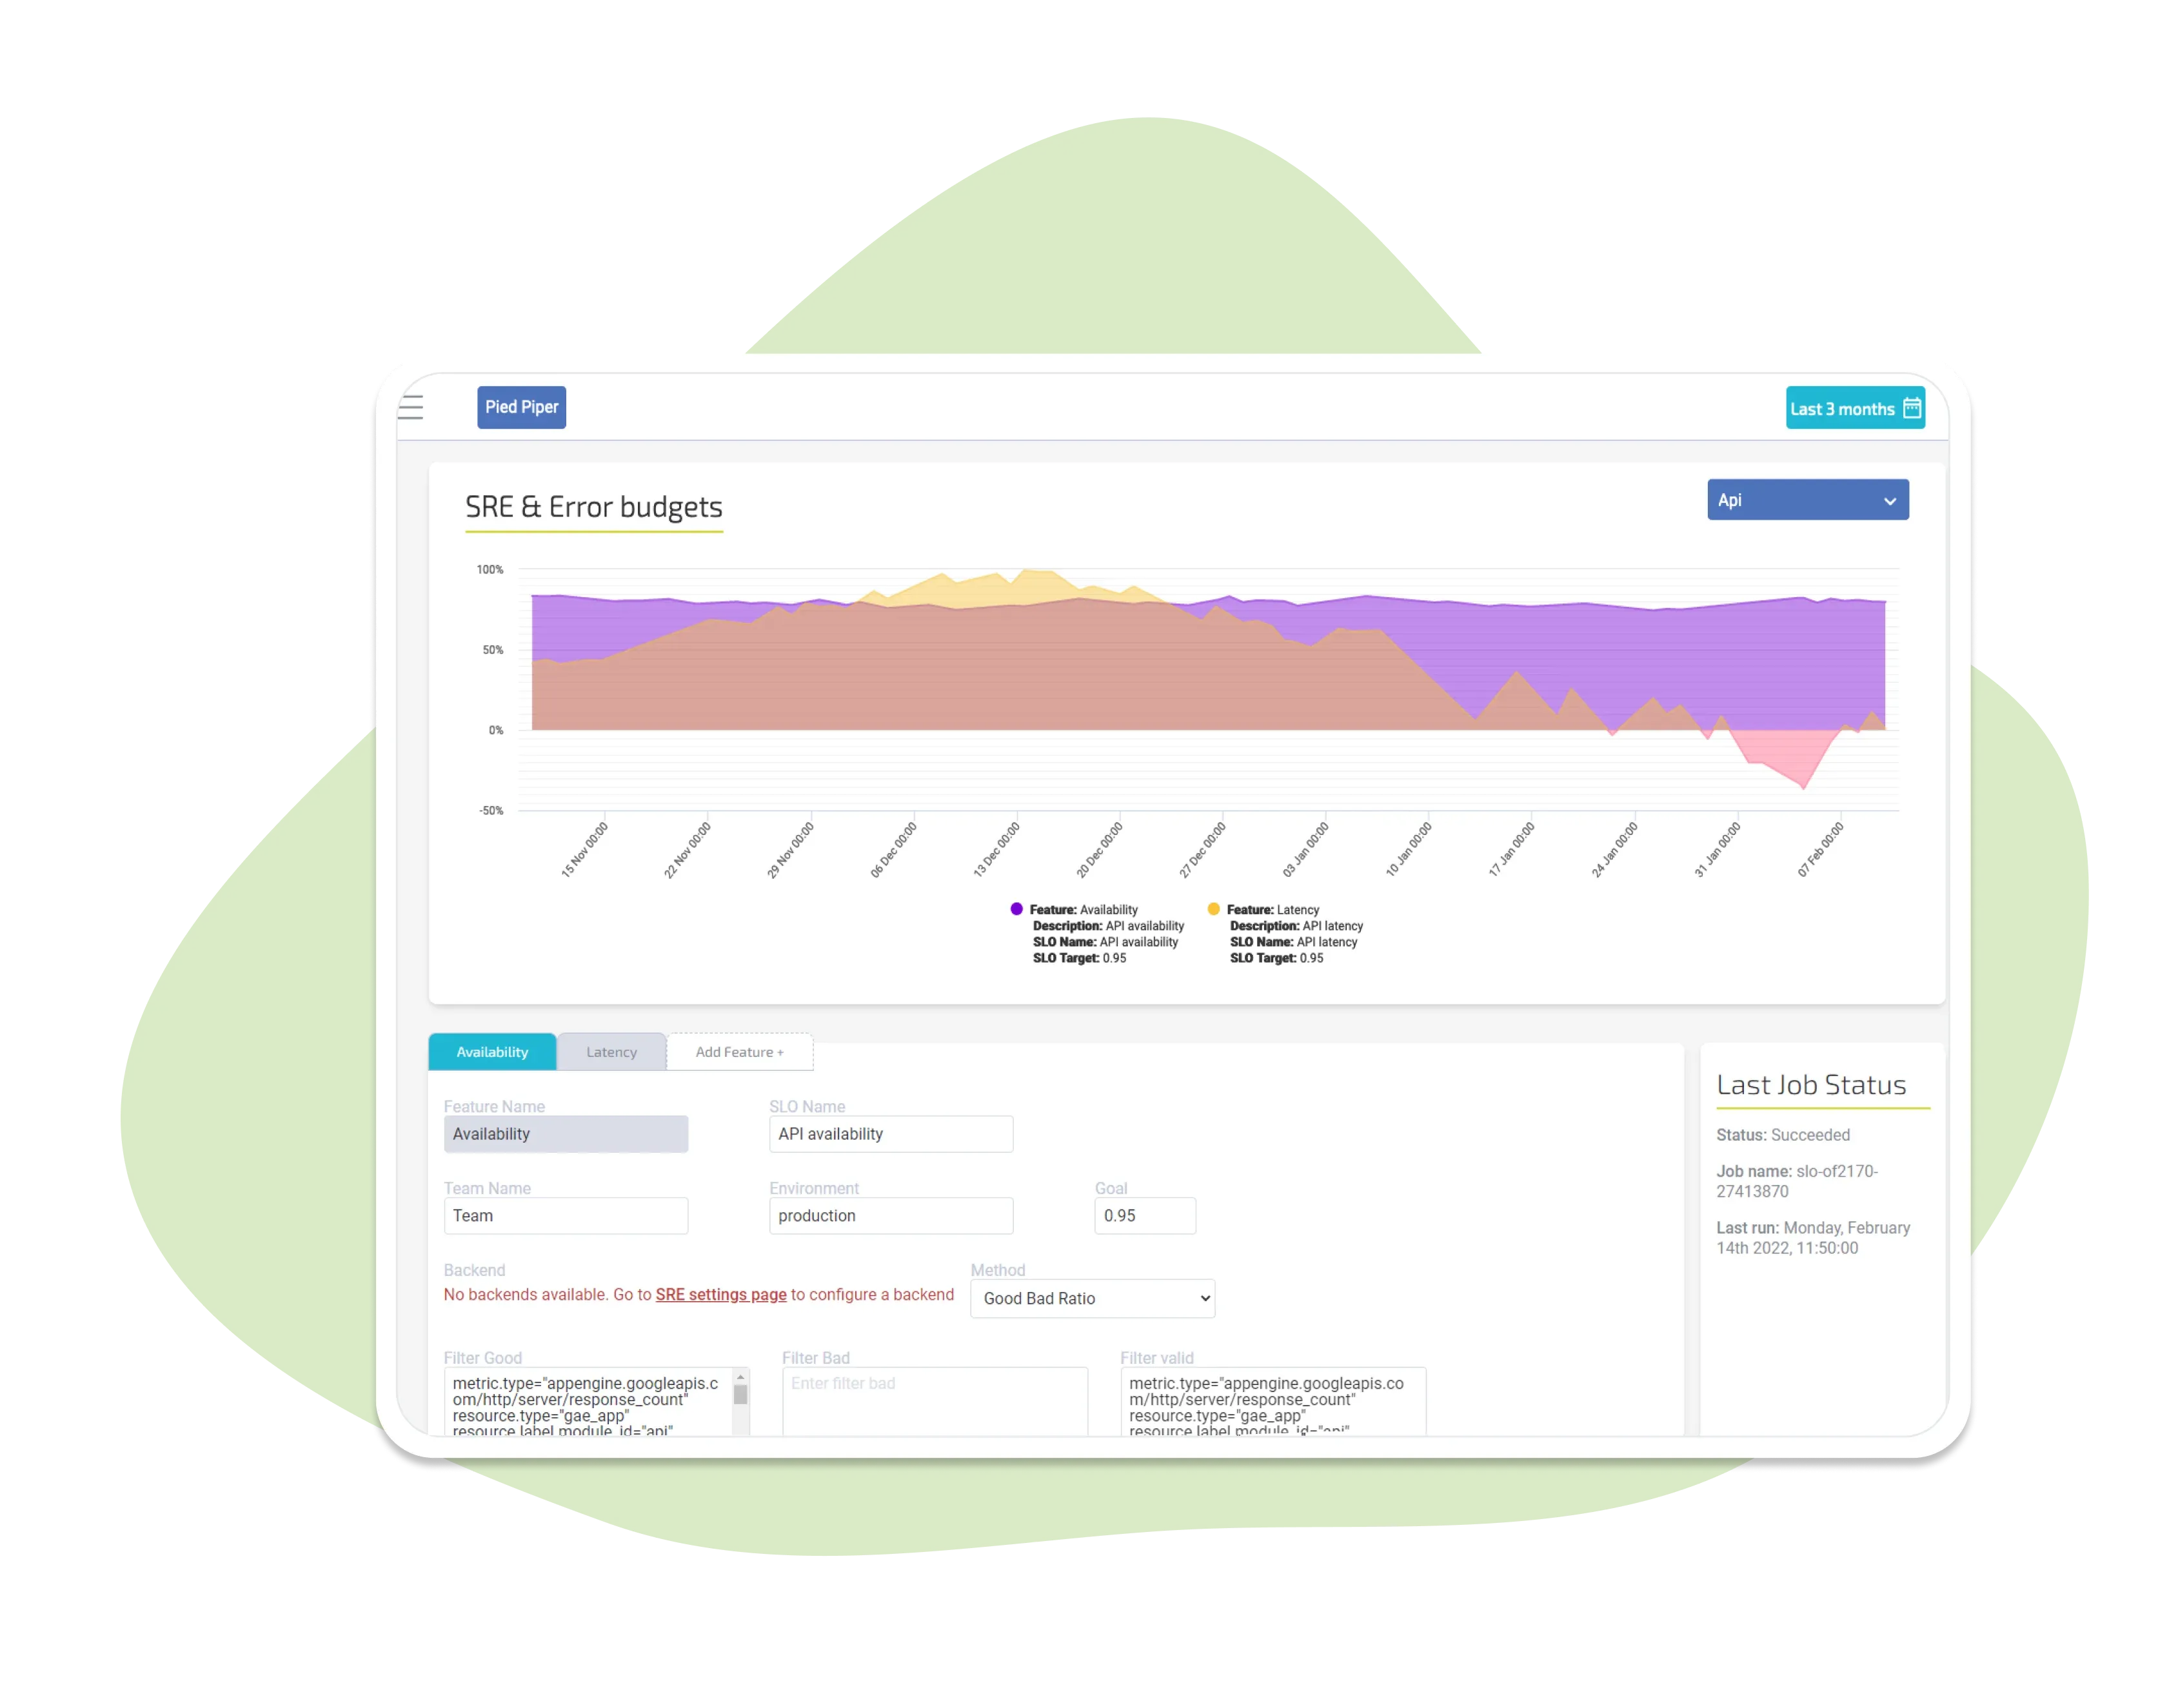
Setting up the process of Error Budgets empowers your teams by granting them increased autonomy in decision-making regarding feature development and quality aspects. Error Budgets provide a defined threshold of acceptable errors or issues in production. By having this framework in place, teams can determine whether they can focus on full-throttle feature development or if attention needs to be given to addressing quality concerns. This approach allows teams to strike a balance between innovation and maintaining high-quality standards, giving them the flexibility to make informed choices and prioritize their efforts effectively.
DORA Metrics
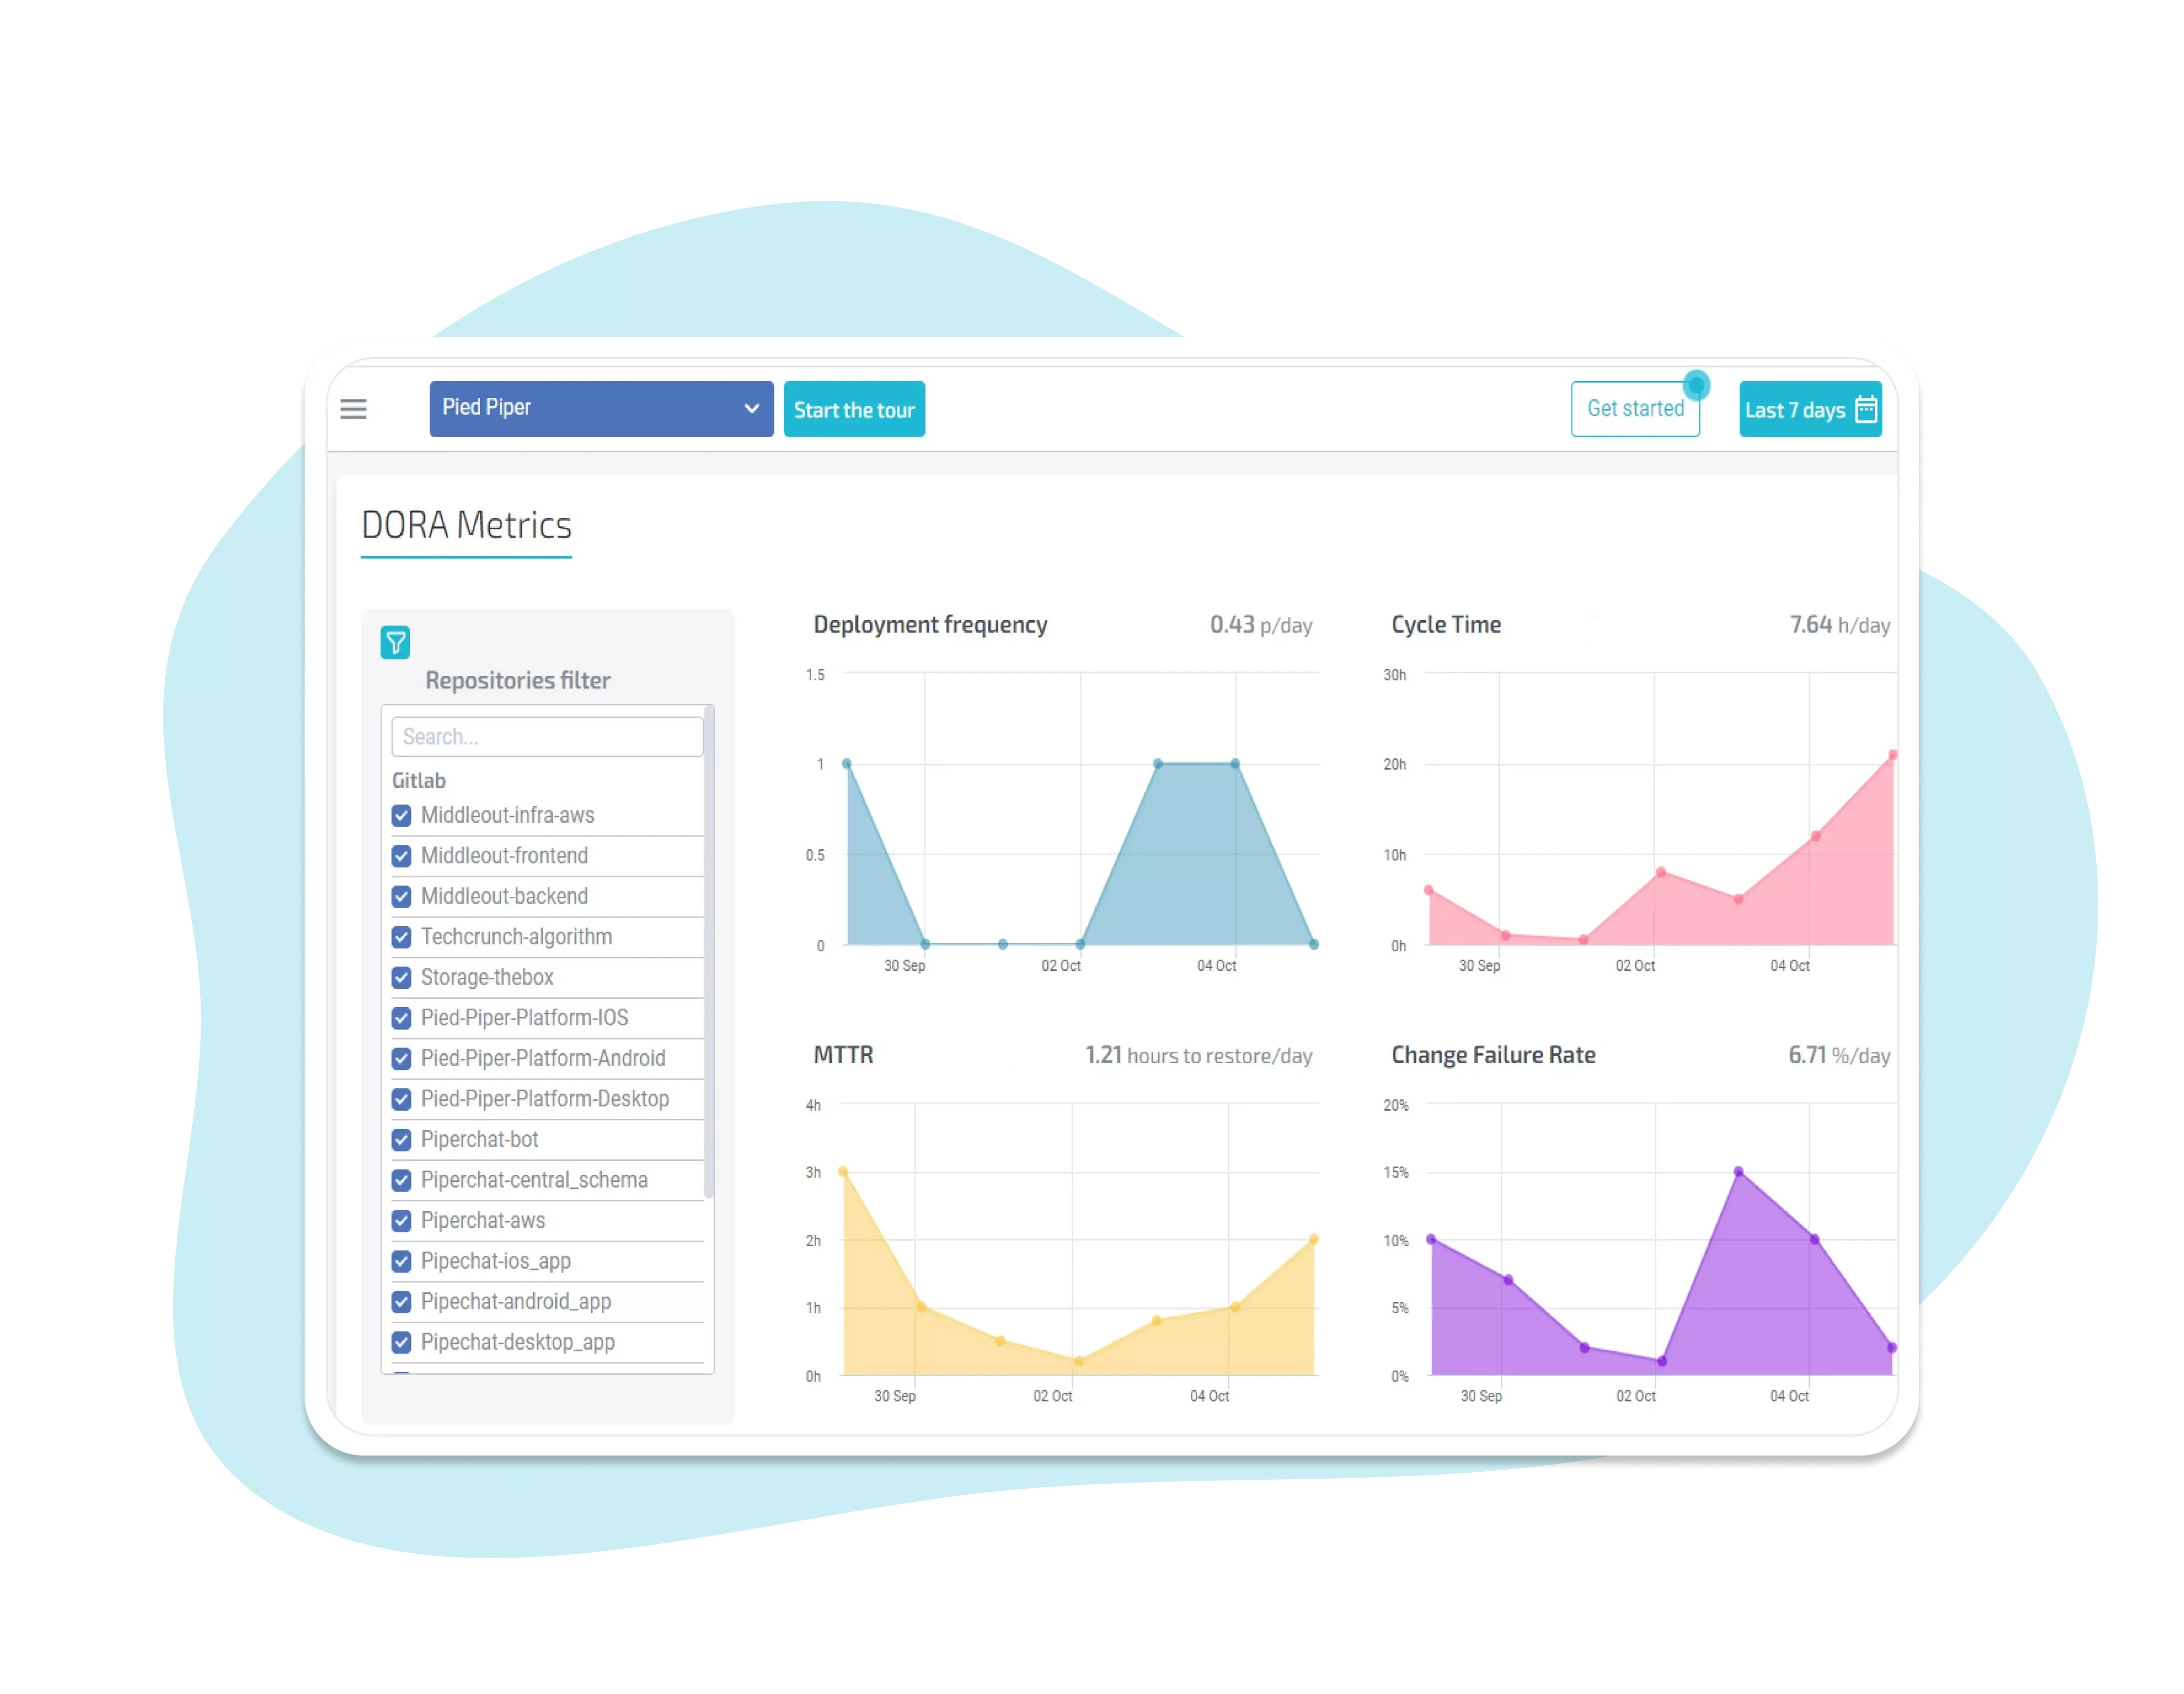
The industry standard DORA (DevOps Research and Assessment) metrics offer a valuable framework for measuring productivity and identifying high-performing teams while considering the quality aspects of software delivery. DORA metrics encompass four key metrics: Deployment Frequency, Lead Time for Changes, Mean Time to Recover, and Change Failure Rate.
DORA metrics enable the measurement of team productivity through quantitative indicators like Deployment Frequency and Lead Time for Changes. These metrics allow organizations to track and compare productivity levels, identify bottlenecks, and drive improvement efforts. Additionally, DORA metrics incorporate quality aspects through Mean Time to Recover and Change Failure Rate, ensuring that productivity gains are achieved without compromising software quality. By including these quality metrics, organizations can identify high-performing teams that consistently deliver value while upholding high-quality standards.
Everything above is measured continuously from your own delivery and production data — no spreadsheets, no self-reporting. See your own teams’ numbers: start a free trial or book a demo.
Less guessing. More shipped software.
Measure faster — lead time, review wait and deployment frequency per team, every sprint
Guard quality — change failure rate, MTTR and Error Budgets
Prove the gain — feature work versus maintenance, from your own data
See it in 30 minutes — on your own data, not a slide deck