The Missing Backstage Plugin: DORA Metrics, Error Budgets, SLOs, and Sprint Flow in One View

Published on 17 July 2025 by Zoia Baletska
Say goodbye to scattered dashboards and hello to real-time insights — right inside your developer portal. The Agile Analytics plugin for Backstage brings the power of engineering intelligence directly to your fingertips. Whether you're a developer, team lead, or platform engineer, this plugin transforms your Backstage instance into a one-stop hub for delivery performance, team health, and operational excellence. It’s everything you need to build better software—faster, smarter, and together.
What Is the Agile Analytics Plugin?
Agile Analytics is an AI-assisted engineering intelligence platform that aggregates technical and team data from your ecosystem — Git, CI/CD, Jira, observability tools, and Slack — to provide actionable insights.
With the Backstage plugin, these insights are embedded natively into the portal where developers already work. The result: dashboards that reflect real progress, real risks, and real wins — right inside your software catalog.
Explore Key Tabs & Metrics
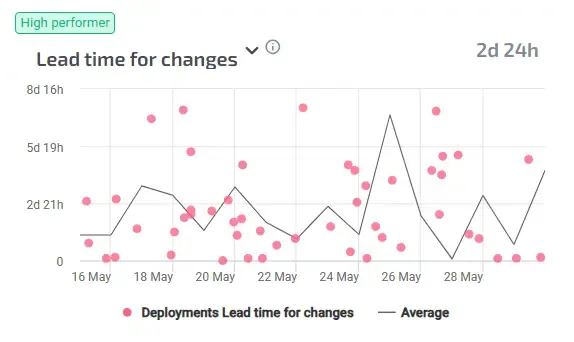
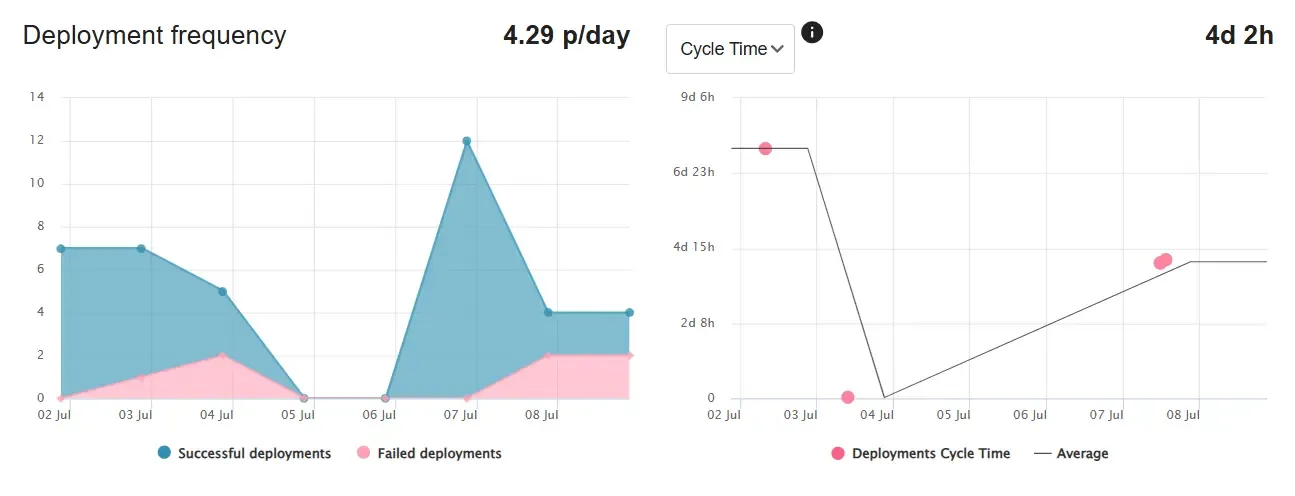
DORA Metrics
Visualize Deployment Frequency, Lead Time for Changes, Change Failure Rate, and Mean Time to Recovery per service or team. Historical charts let you spot trends and surface regressions quickly. Whether you're scaling DevOps practices or aligning delivery with business goals, DORA gives you the pulse of your software performance.
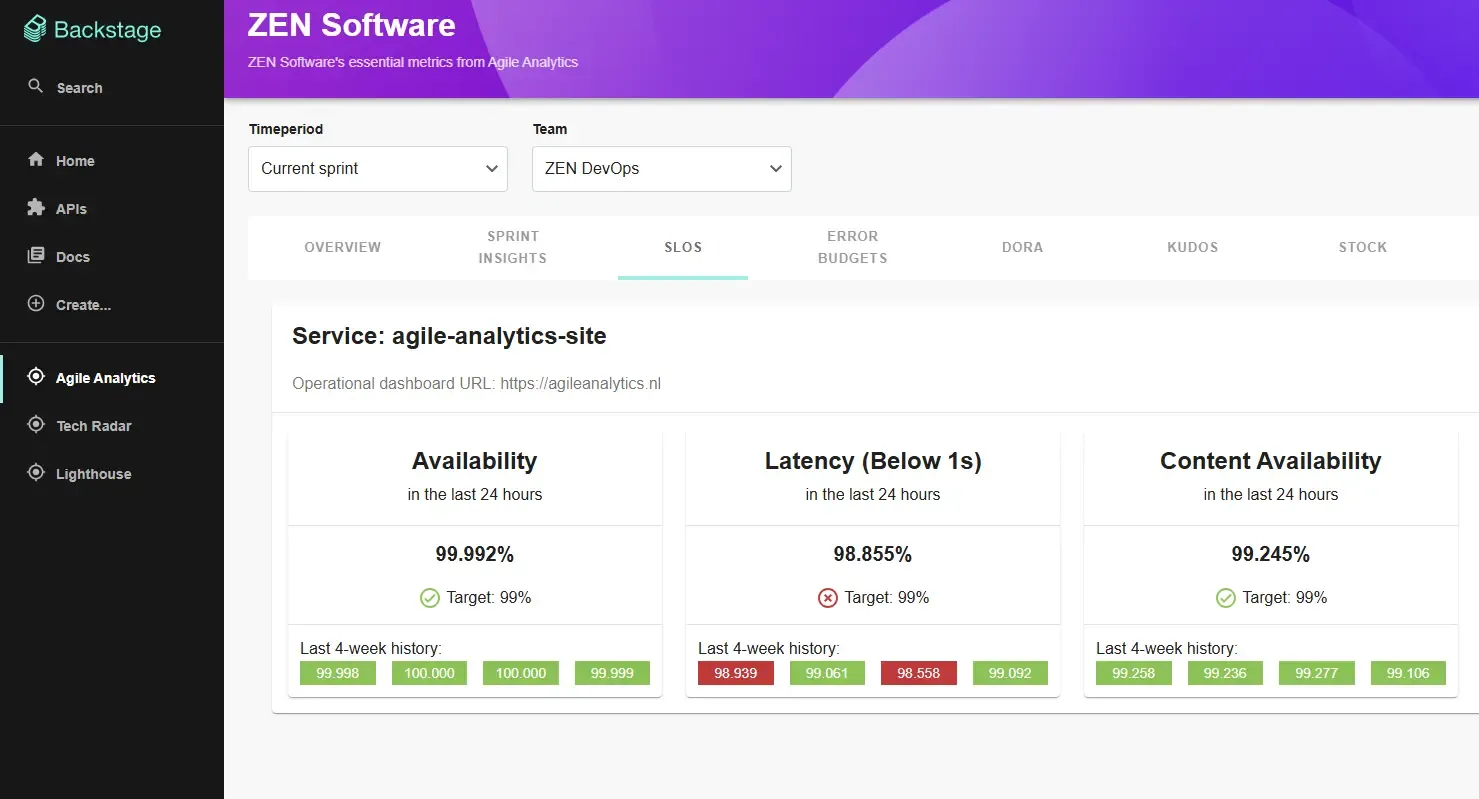
SLOs (Service Level Objectives)
Track how each service performs against its defined reliability targets. This tab shows current SLO status, breach risk, and a 4-week historical view to help SRE and platform teams stay ahead of issues. It's your reliability cockpit—right where engineers can act on it.
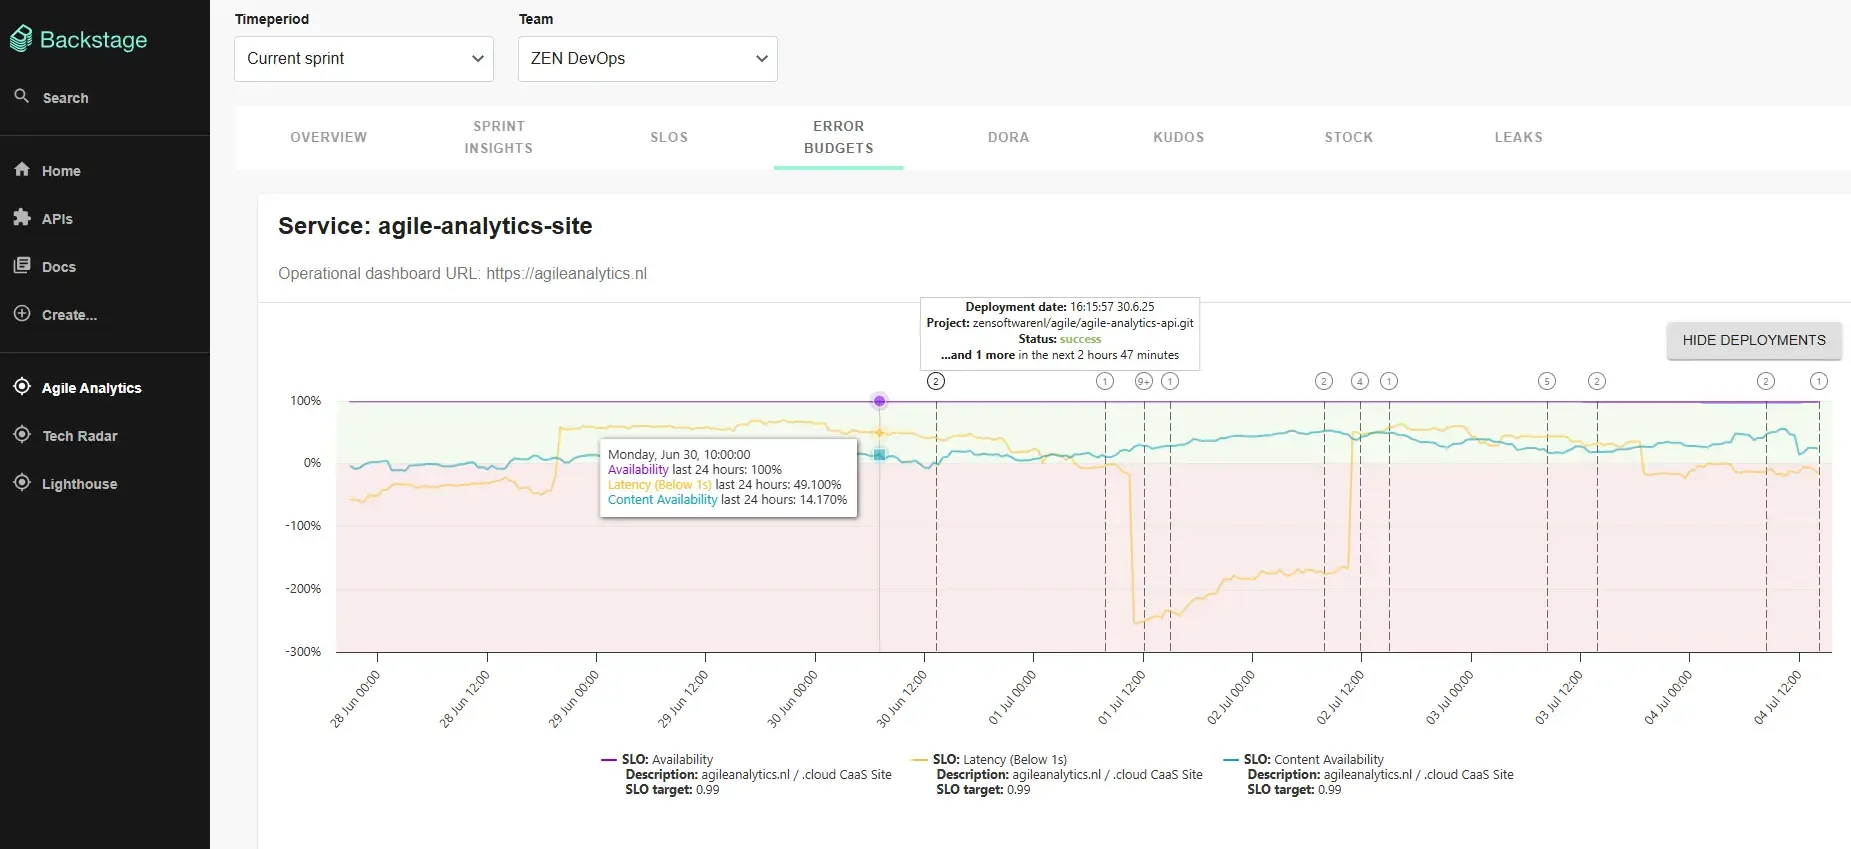
Error Budgets
Understand how much reliability "budget" remains before an SLO breach. This section displays intuitive charts that visualise usage over time, making it easy to balance innovation and stability. When an incident consumes your error budget, it’s clearly reflected, so trade-offs become transparent and data-informed.
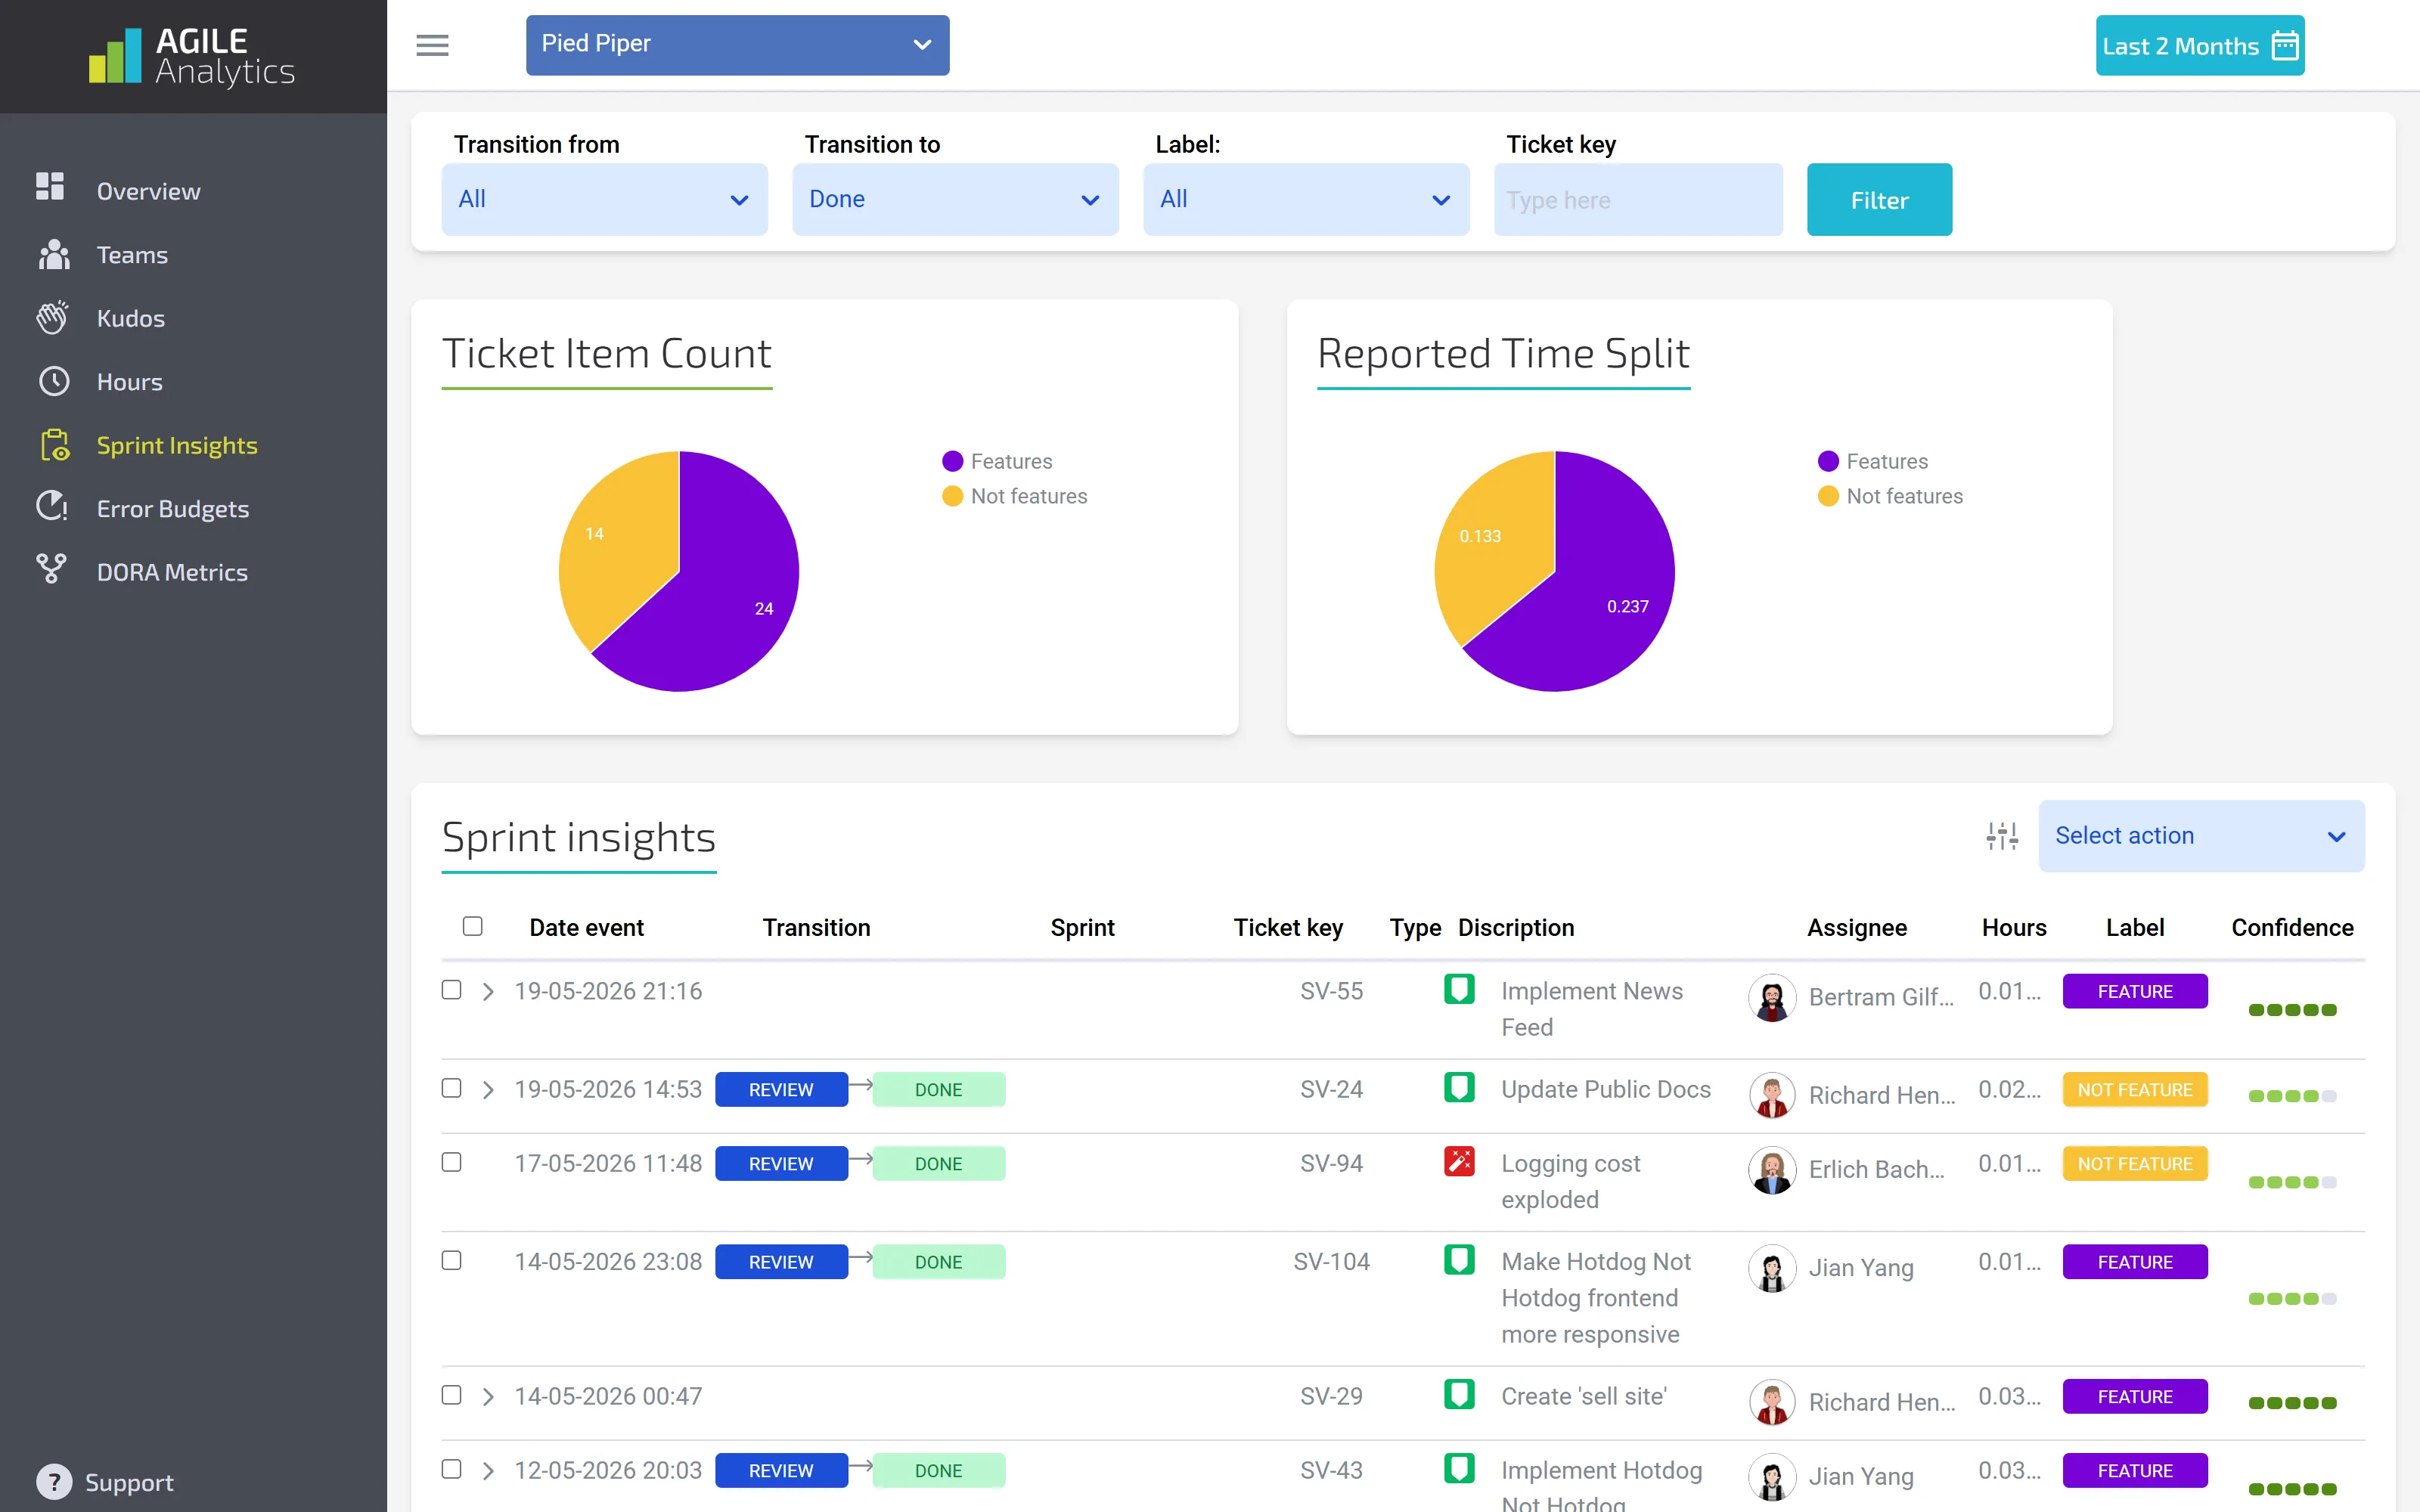
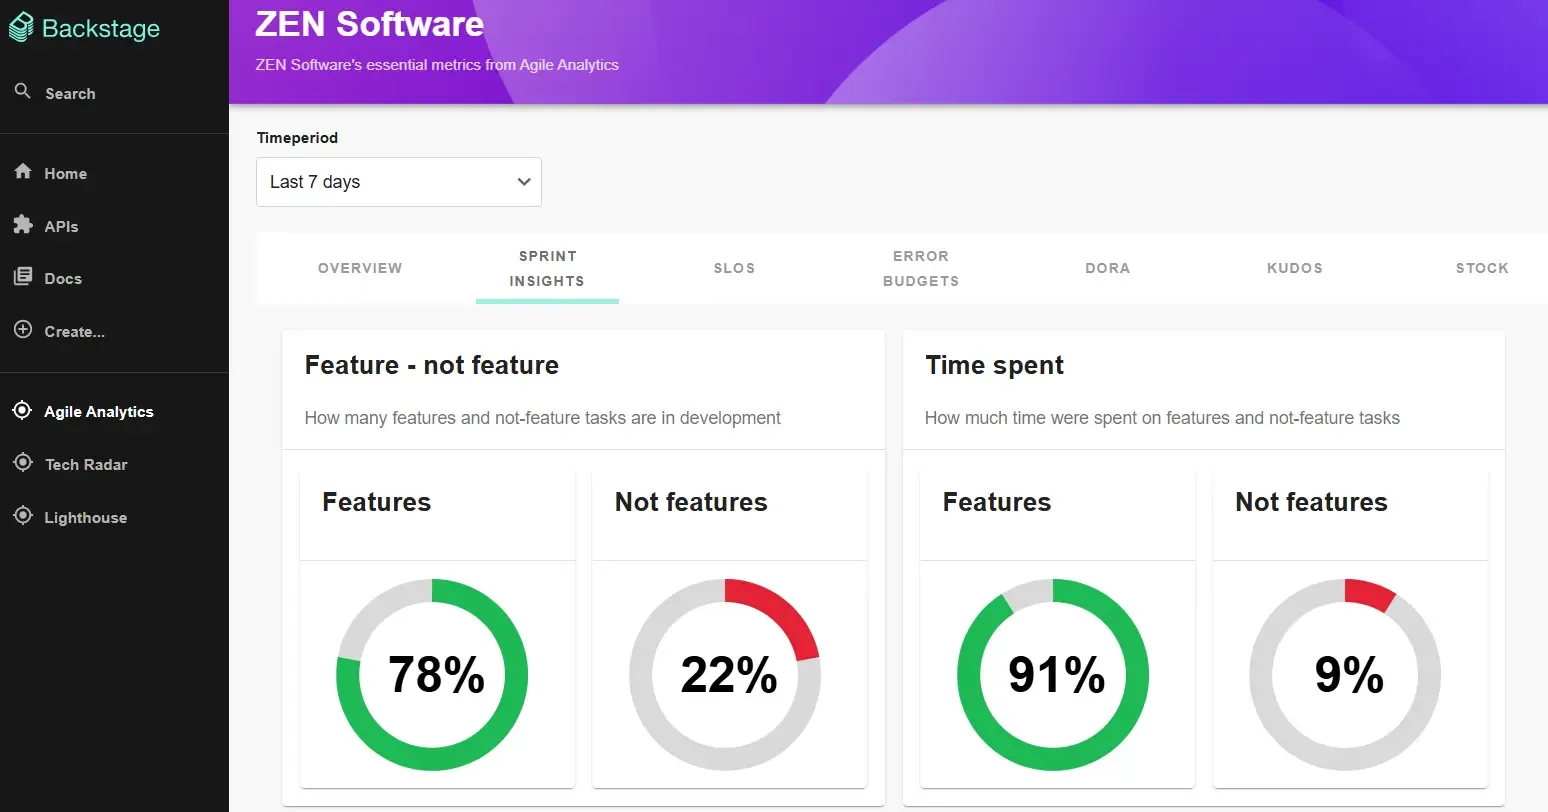
Sprint Insights
Get a bird’s-eye view of sprint health and flow metrics. See how work progresses through stages, identify delivery bottlenecks, and assess how scope creep or blocked tasks affect team velocity. These insights make retrospectives sharper and standups more focused.
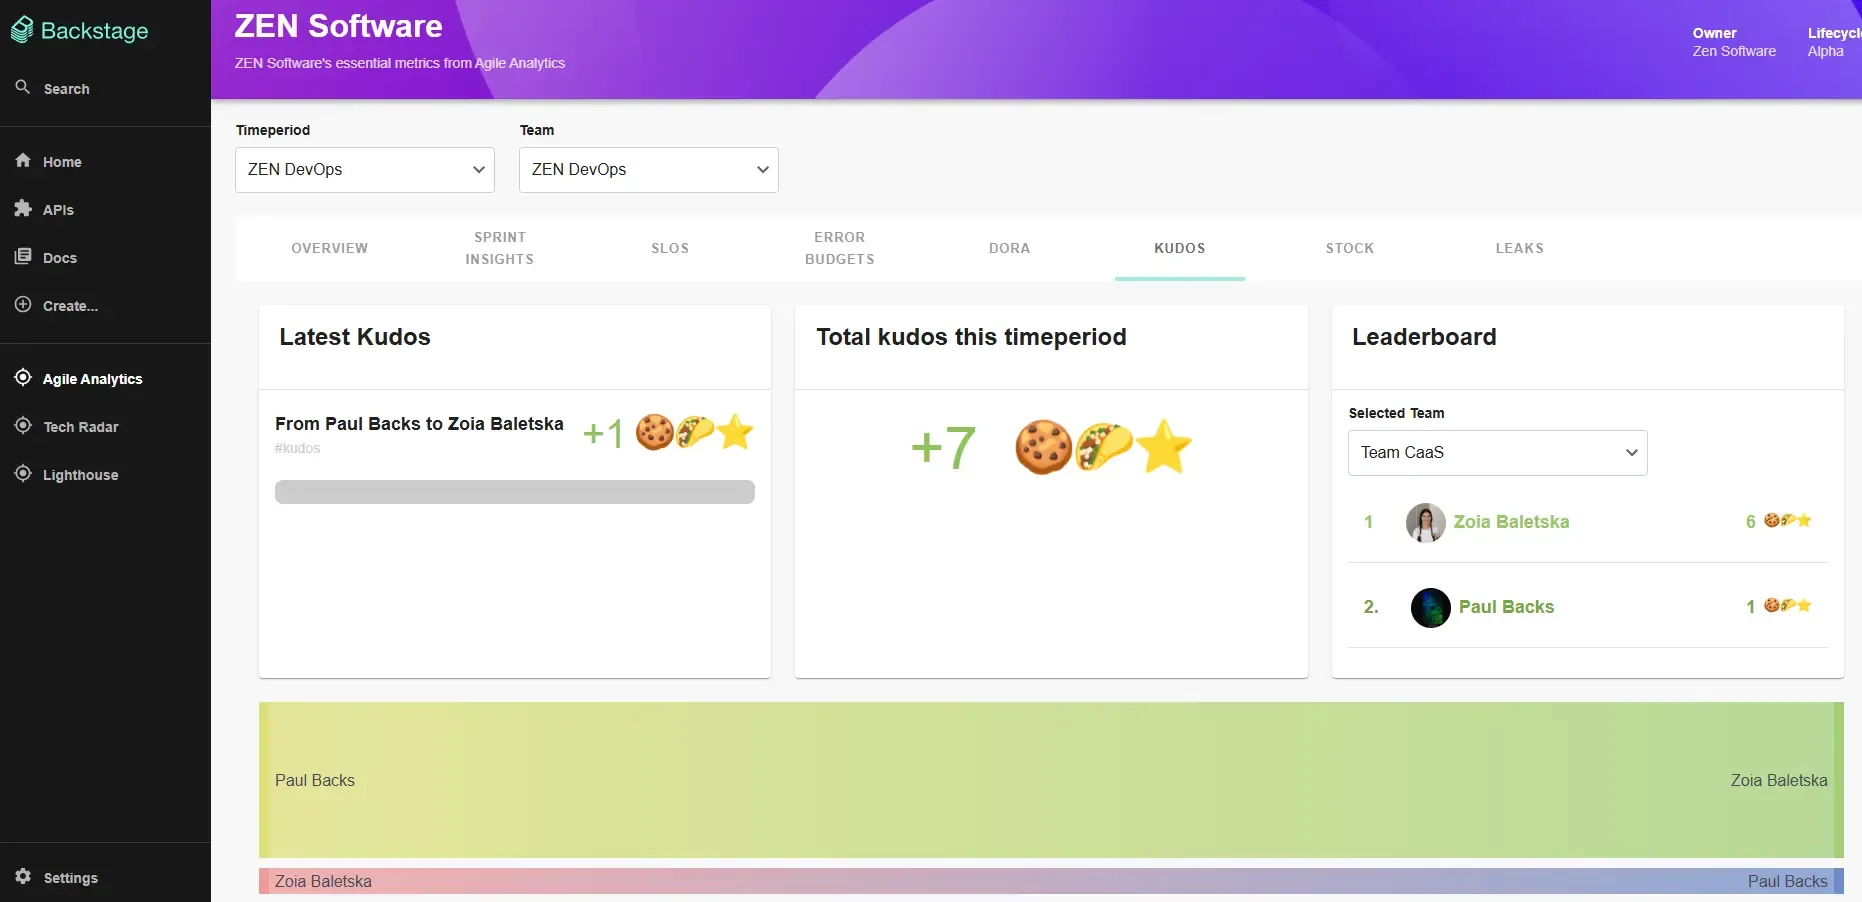
Kudos
Build a stronger engineering culture with the Kudos tab, which syncs with Slack to show a live leaderboard of peer recognition. A Sankey chart visualises who’s giving kudos to whom — and how often — encouraging positive feedback loops across teams. This human layer of data reveals what numbers alone can't: morale, support, and collaboration.
Benefits of Integration
📍 Centralised Monitoring: Surface delivery, reliability, and culture metrics in one place inside your Backstage portal.
📊 Informed Decisions: Use live dashboards to identify risks, plan sprints, and allocate engineering efforts where they matter most.
📈 Continuous Improvement: See bottlenecks, recognise impact, and track progress with clear, team-oriented metrics.
By embedding Agile Analytics into Backstage, your portal evolves from a catalogue into a real-time feedback hub — bridging technical metrics with team experience, delivery speed with quality, and goals with measurable progress.
📦 Get the Agile Analytics plugin for Backstage
Let your teams build, deploy, and improve — all from one place.
Supercharge your Software Delivery!
Implement DevOps with Agile Analytics
Implement Site Reliability with Agile Analytics
Implement Service Level Objectives with Agile Analytics
Implement DORA Metrics with Agile Analytics